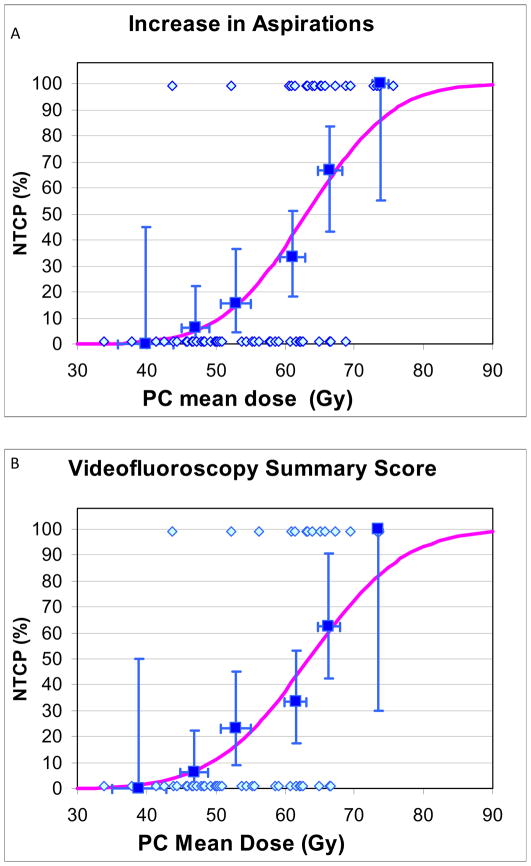
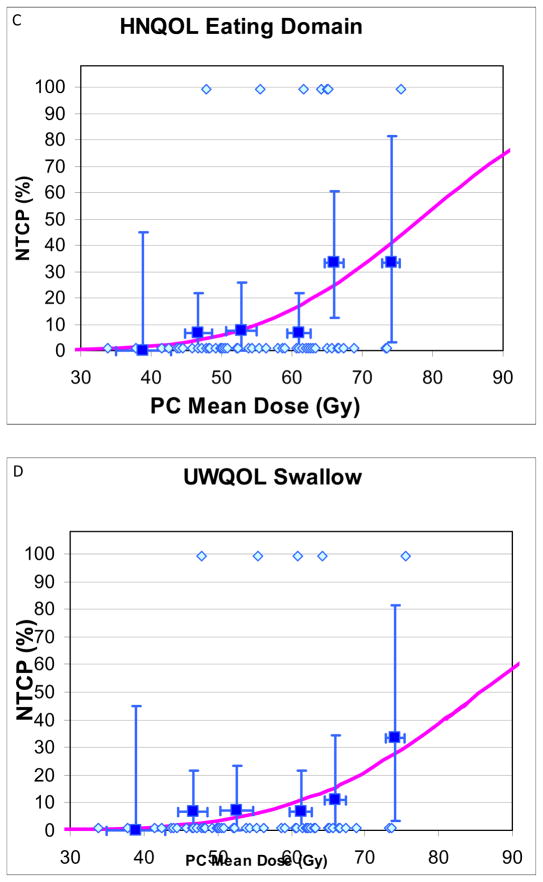
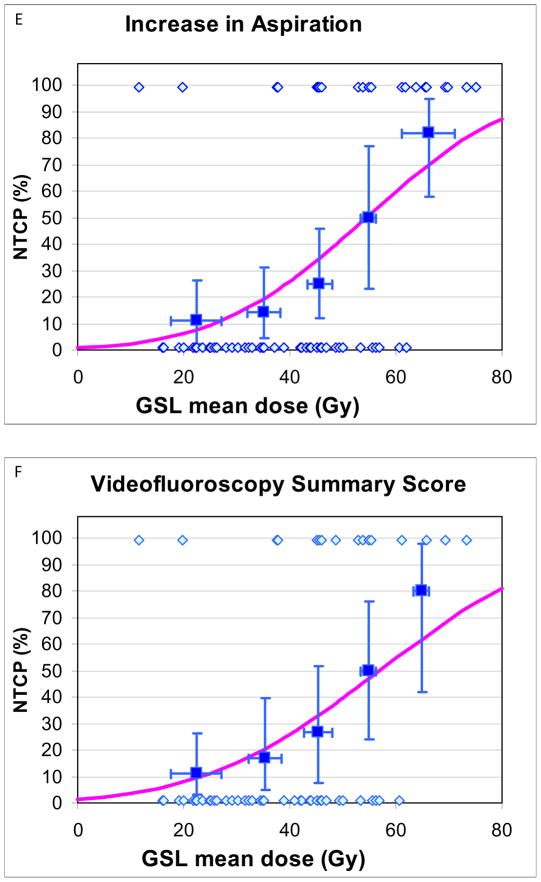
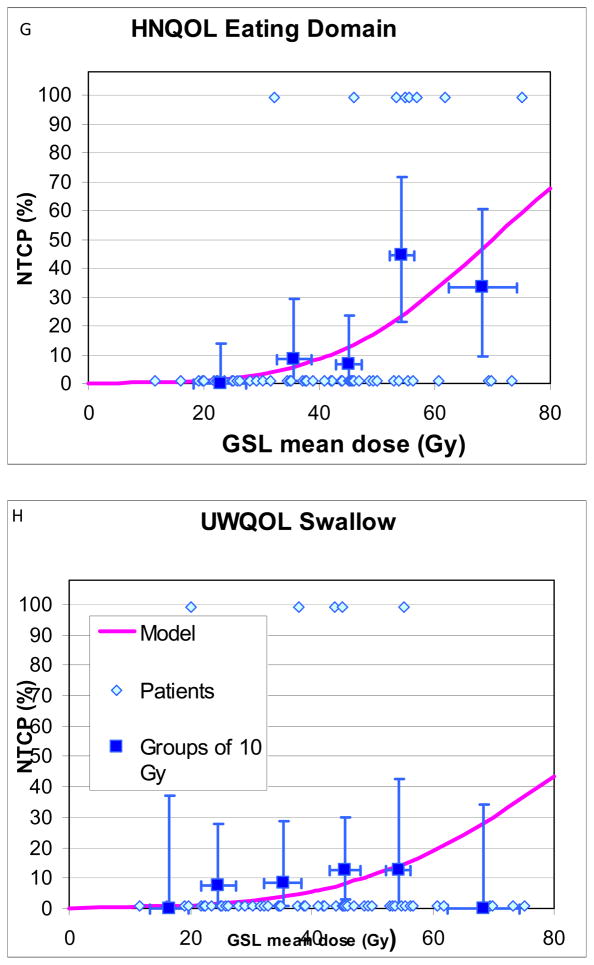
Fig 1.
Normal tissue complication probablility (NTCP) curves for long-term increase in various measures of videofluoroscopy-based and patient-reported dysphagia after therapy compared with pre-therapy, vs. doses to the pharyngeal constrictors (PC) (A–D) and glottic-supraglottic larynx (GSL) (E–H). UWQOL: University of Washington quality of life questionnaire. HNQOL: Head-neck cancer quality of life questionnaire.
In each figure the symbols at the bottom represent patients with no “complications” and the at the top patients with “complications”. The horizontal error bars are bins of 7 Gy for the PC plots and 10 Gy for the GSL plots. The y axis error bars represent 80% confidence intervals. The definitions of “complications” are detailed in Methods.


