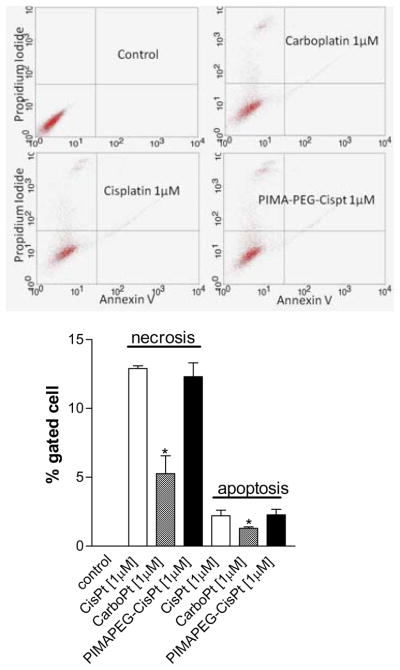
Figure 3.
Representative FACS scatter plots showing the mechanisms underlying cell death induced by free cisplatin, carboplatin or PIMA-PEG-Cisplatin nanoparticles. The cells were labeled with Annexin V-Alexa Fluor 488 and propidium iodide and then FAC-sorted. Graph shows the % of cells at each stage following different treatments. Data shown are mean ± SEM from n=3 (independent experiments).

