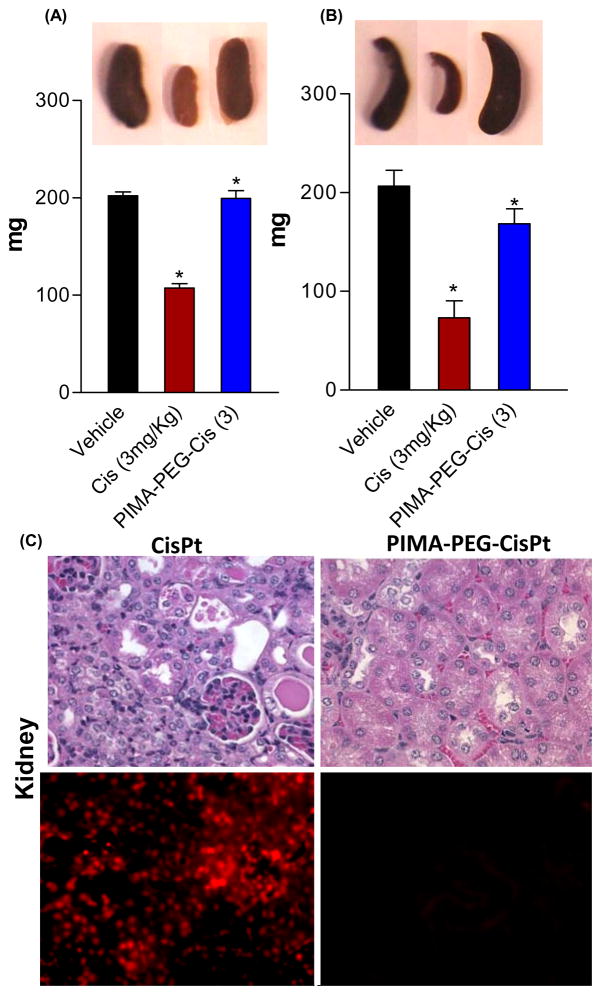
Figure 5.
(A-B) Graphs show effect of treatments on kidney and spleen weight respectively. (D) Representative images of kidney sections. Top panel is stained with H&E and bottom panel shows epifluorescence images of kidney sections stained for TUNEL. Data shown are mean ± SEM, with n>4 at each data point. *p<0.05 vs vehicle treated controls.

