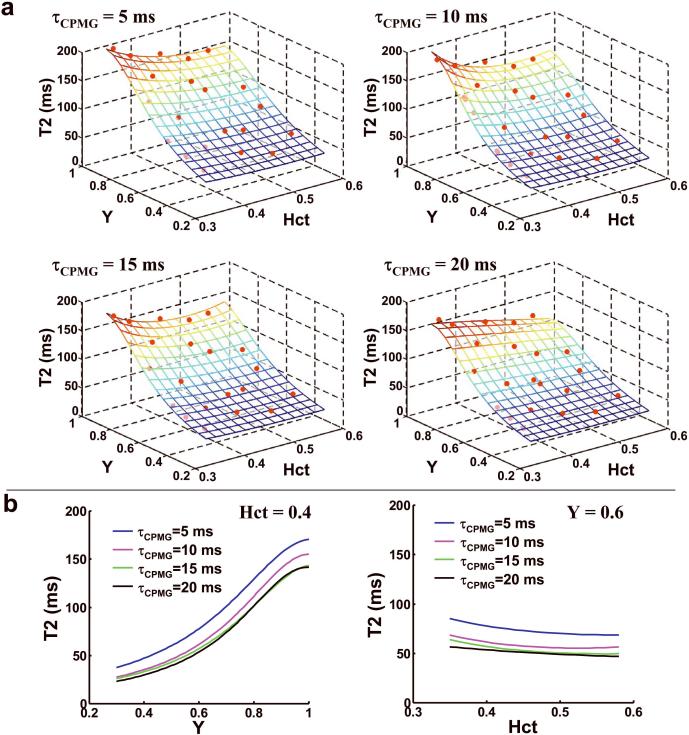
Figure 1.
Relationship between T2, Y, and Hct in blood samples. (a) T2 values of blood samples as a function of oxygenation (Y) and hematocrit (Hct) at four different τCPMG. The symbols indicated the experimental data points and the mesh showed the model-fitted surface. The surface was displayed with partial transparency thus the symbols below the surface can also be seen, although with a slightly darker color. The values of Y and Hct were written in fractions. The analytical expressions of the surfaces are listed in Equations [1–4] and Table 1. (b) Two-dimensional plots between T2 and Y at a fixed Hct of 0.4 and between T2 and Hct at a fixed Y of 0.6. Each plot shows curves at four different τCPMG values.

