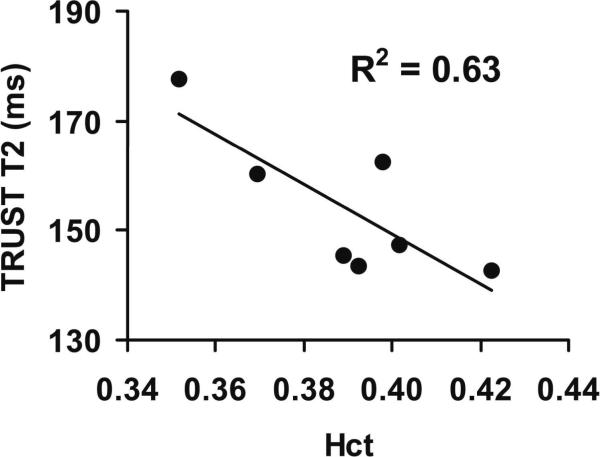
Figure 3.
Relationship between arterial blood T2 and hematocrit in humans during normoxia. The T2 was measured using TRUST MRI and the Hct was determined with a centrifuge. The arterial blood was close to full oxygenation under this condition (Ya=0.973±0.006). The T2 was therefore primarily dependent upon the Hct levels. The solid line represents the linear fitting curve. This plot is based entirely on the in vivo data, and did not involve the calibration data.

