
Figure 2.
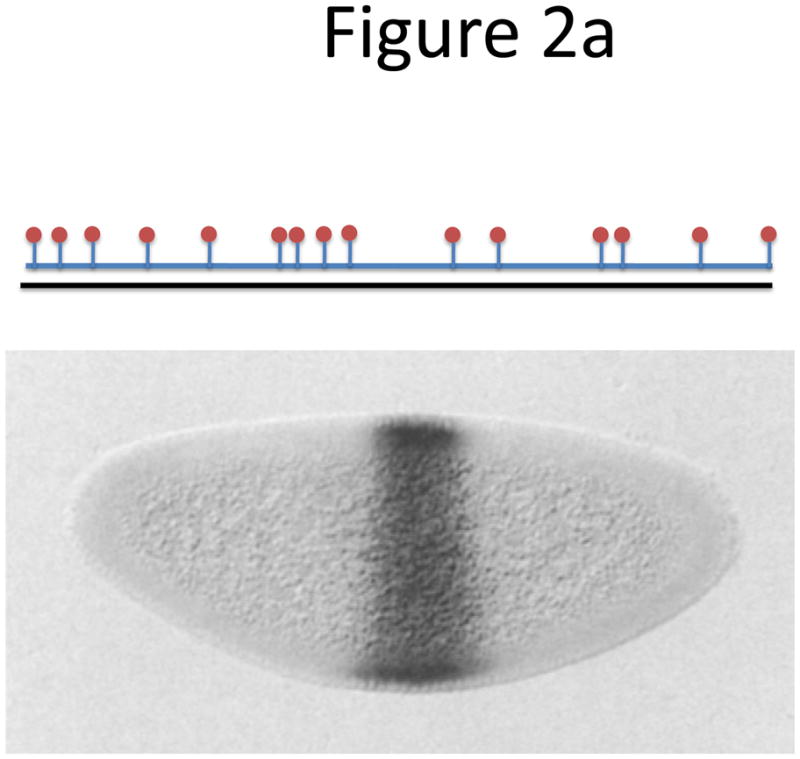
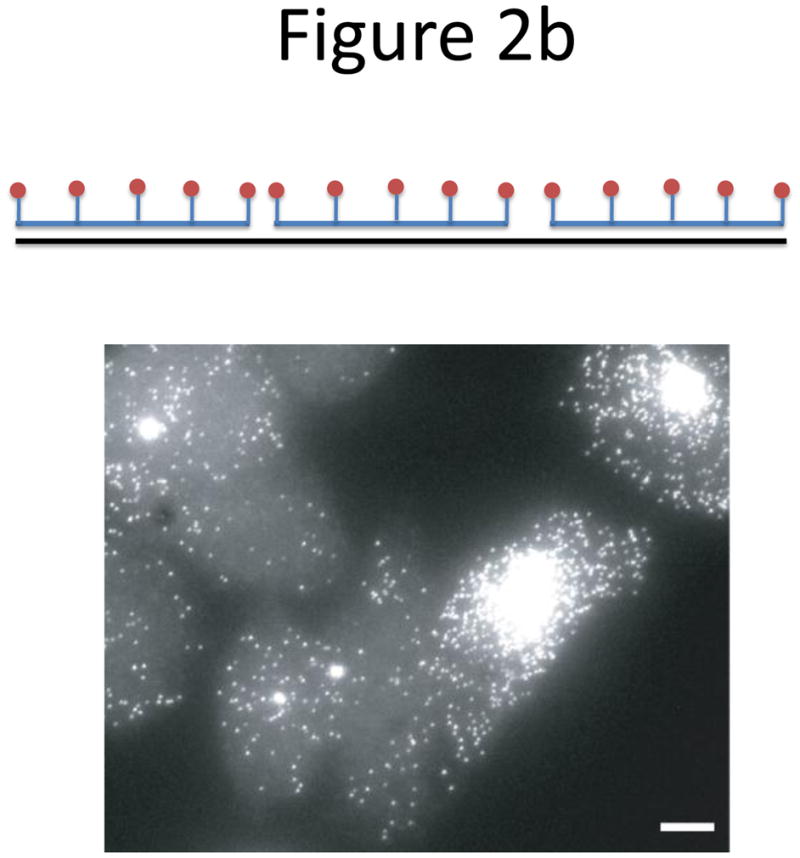
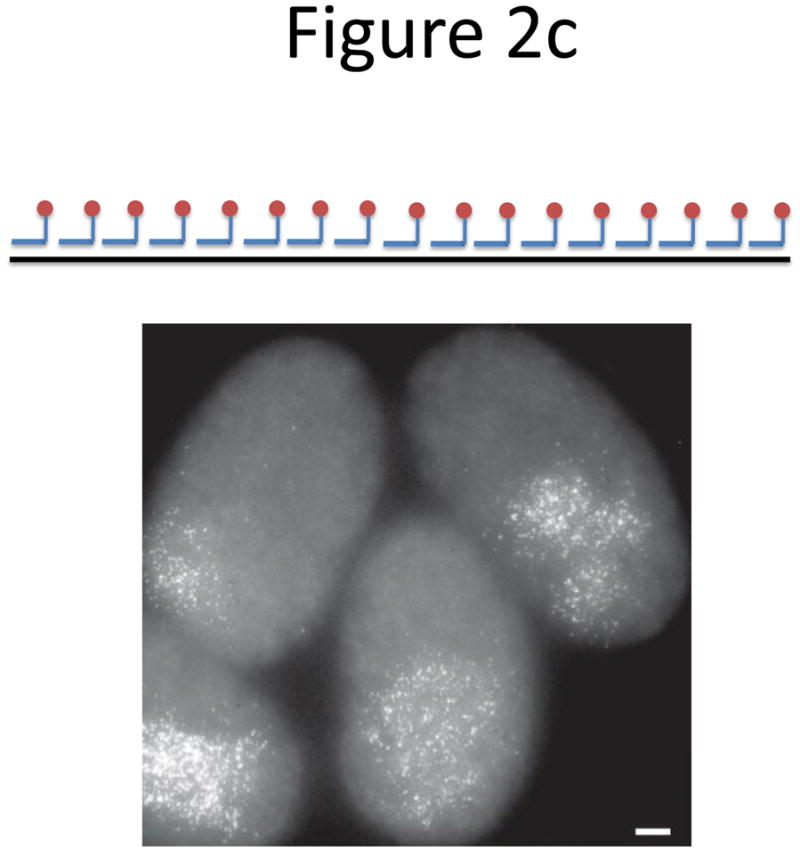
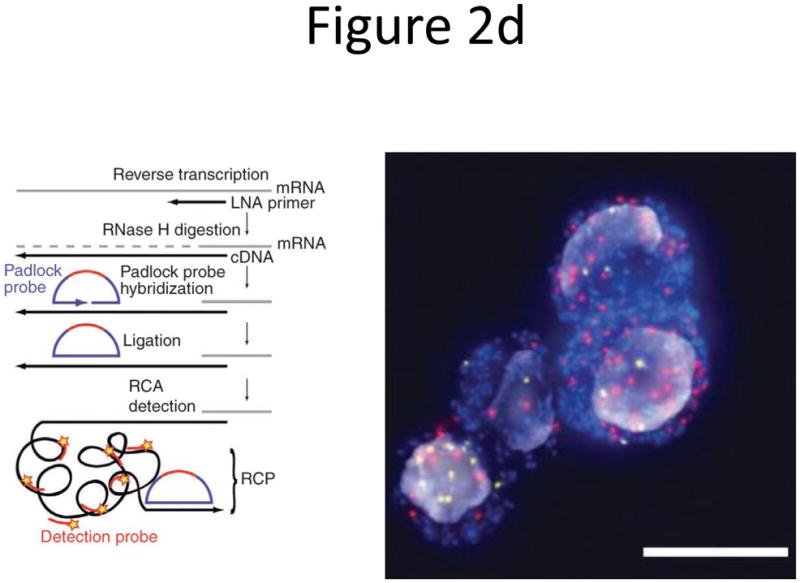
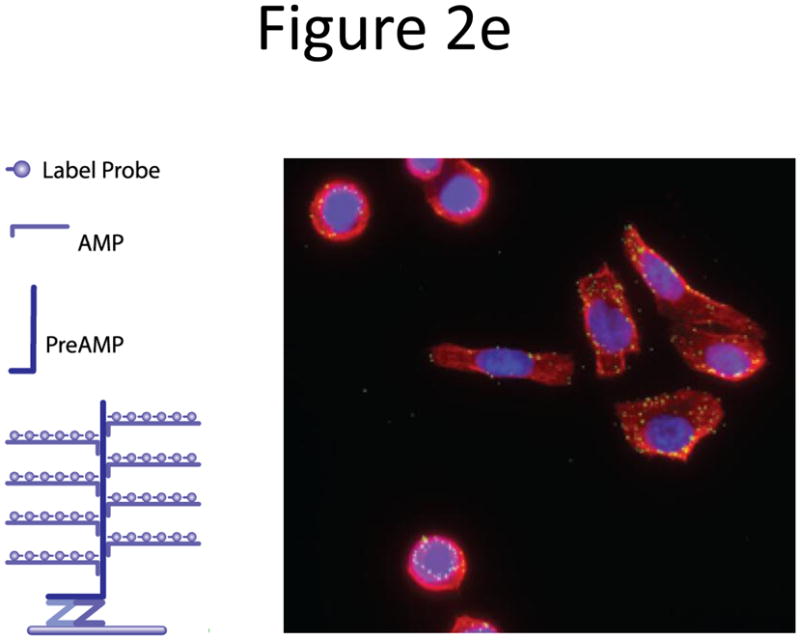
Probe designs for ISH. (a) Schematic of long probes with randomly distributed labeled nucleotides (top) and Drosophila embryo hybridized with probes complementary to the hunchback gene (bottom; reprinted from ref. 77). (b) Schematic of shorter probes, each coupled to 3–5 labeled nucleotides (top) and fluorescence image, showing single mRNA transcripts in mammalian cells (bottom; reprinted from ref. 26). Scale bar, 5 μm. (c) Schematic of multiple singly labeledshorter probes (top) and C. elegans embryos hybridized with probes complementary to the end-1 gene (bottom; reprinted from ref. 31). Scale bar, 5 μm. (d) Illustration of rolling-circle amplification (RCA) of padlock probes34; fluorescent probes bind their complementary sequences in the rolling circle product (RCP) (left). Fluorescence image (right) illustrates detection of ERBB2 (also known as HER2; red), MYC (yellow) and ACTB (blue) transcripts in primary human fibroblast cultures (reprinted from ref. 34). Scale bar, 20 μm. (e) Schematic of a branched DNA detection method using four probe sets. Multiple label probes bind multiple amplifier molecules that are in turn bound to a pre-amplifier molecule that binds the transcript-specific probe pairs. Image of ERBB2 (green) and 18S rRNA (red) in SKBR3 cells (right; reprinted from http://www.panomics.com/).