
Figure 10.
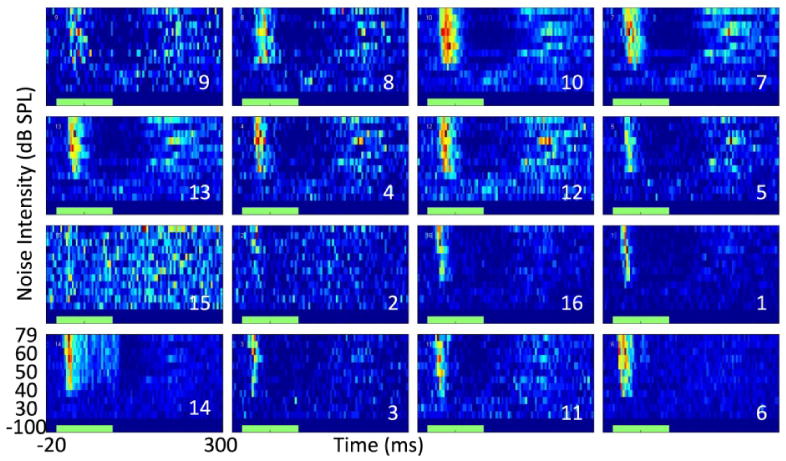
Simultaneously-recorded, noise-evoked, peri-stimulus time histograms from the auditory cortex (top 2 rows) and thalamus (bottom 2 rows) of an anesthetized rat. The green bar along the x-axis reflects the timing of the broadband acoustic noise stimulus.