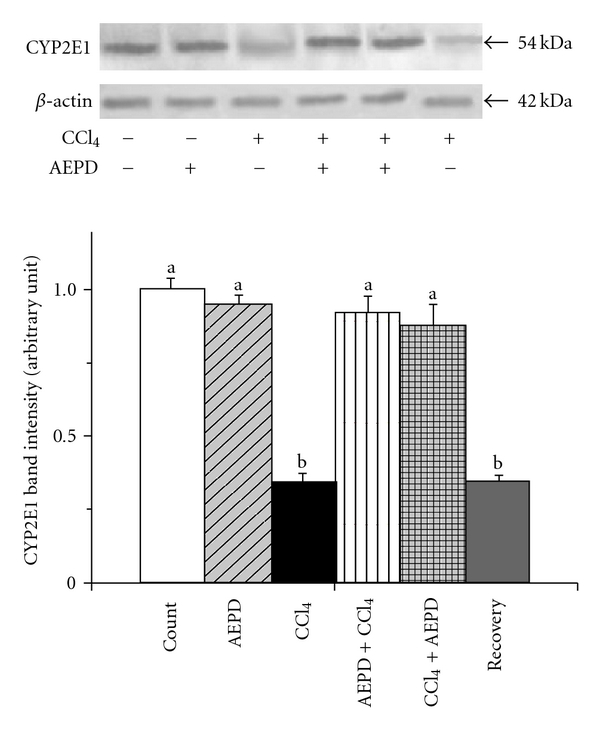
Figure 6.

Western blot analysis of the expression of CYP2E1 in the hepatic tissue of the experimental animals. The relative bands intensities were determined using NIH image software and the control band was given an arbitrary value of 1. Vehicle: CYP2E1 expression in normal animals, AEPD: CYP2E1 expression in the animals treated with AEPD only; CCl4: CYP2E1 expression in the CCl4 intoxicated animals; AEPD + CCl4: CYP2E1 expression in the animals treated with AEPD prior to CCl4 intoxication; CCl4 + AEPD: CYP2E1 expression in the animals treated with AEPD post-CCl4 intoxication and Recovery: CYP2E1 expression in the animals of recovery group. Data are mean ± SD, for six animals per group and were analyzed by one-way ANOVA, with Student-Newman-Keuls post hoc tests. Differences were attributed at P < .05, and homogeneous subgroups share common superscripted letters.
