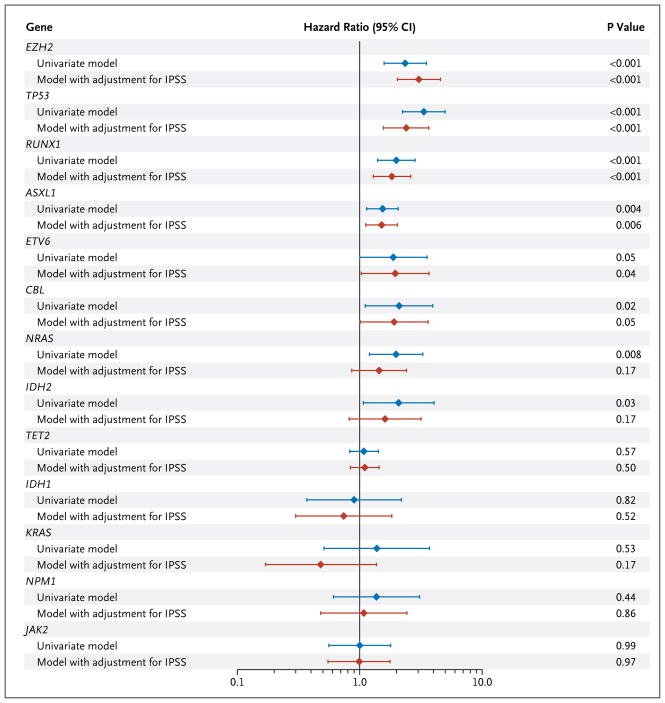
Figure 2. Hazard Ratios for Death from Any Cause, According to Presence (vs. Absence) of Mutation in Each of Seven Genes.
Results are shown, on a log10 scale, for univariate analyses as well as for analyses with adjustment for the International Prognostic Scoring System (IPSS) risk category (based on the percentage of blasts in bone marrow, the karyotype, and the number of cytopenias) (for details, see Table 2 in the Supplementary Appendix). CI denotes confidence interval.

