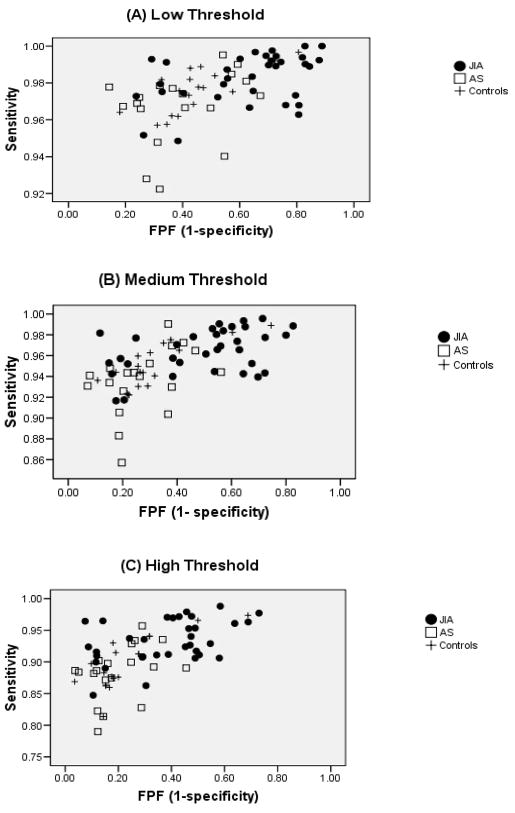
Figure 1. Actigraphy Sensitivity vs. 1-specificity.
Data represent low (A), medium (B), and high (C) actigraphy thresholds. JIA = ●, Asthma (AS) = □, + = controls. False positive fraction (FPF) is defined as the fraction or probability of actigraphy reporting sleep when PSG detects wake. The figures show the discrimination for each subject with respect to threshold. Each point represents the decision criterion (true positive vs. false positive) for each child at a given threshold.

