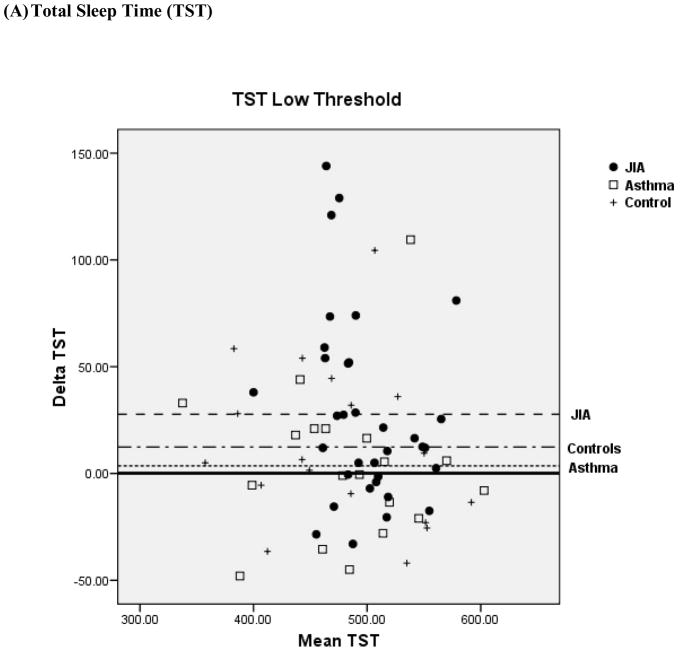
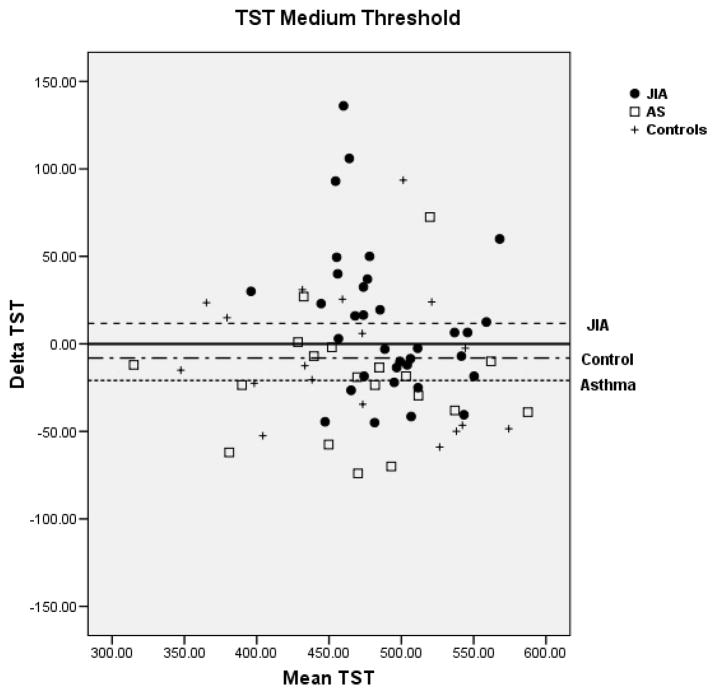
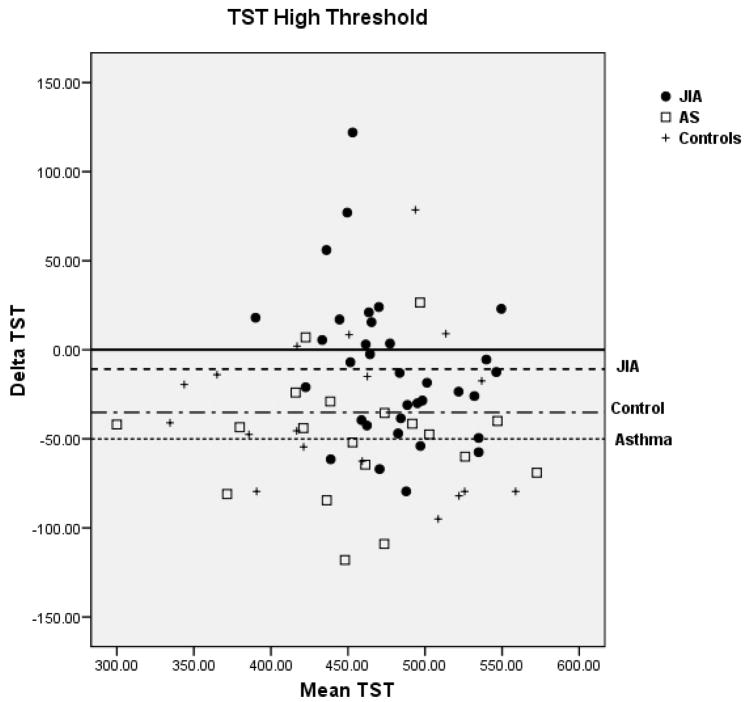
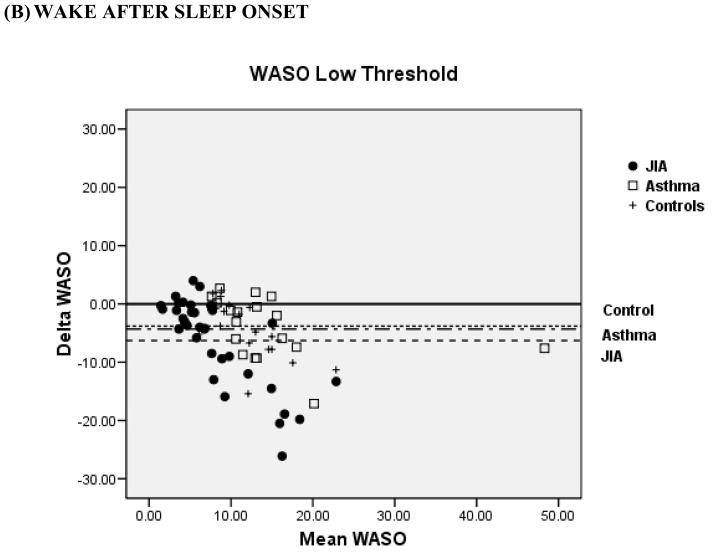
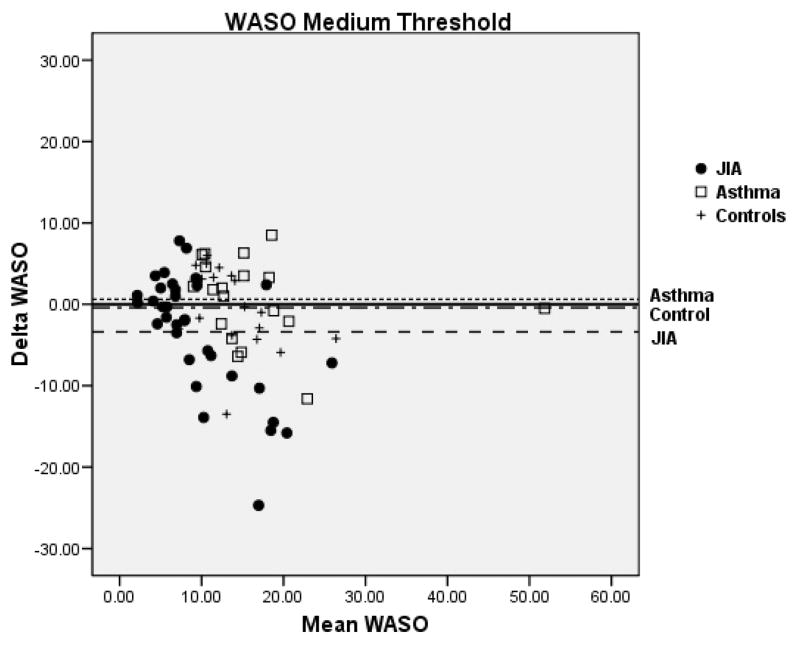
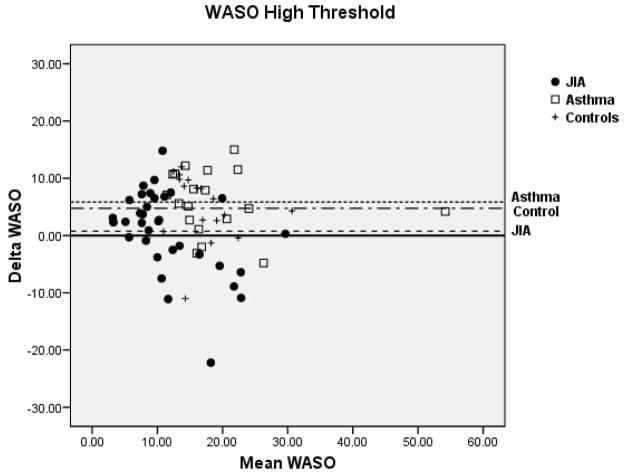
Figure 2.
Bland-Altman plots between Polysomnography and Actigraphy for Total Sleep Time (TST) (A) and Wake After Sleep Onset (WASO) (B). Data represent the mean bias ± standard deviation which provides an estimate of the degree of variation of the difference between polysomnography and actigraphy measures of the TST and WASO. JIA = ●, Asthma (AS) = □, + = controls.

