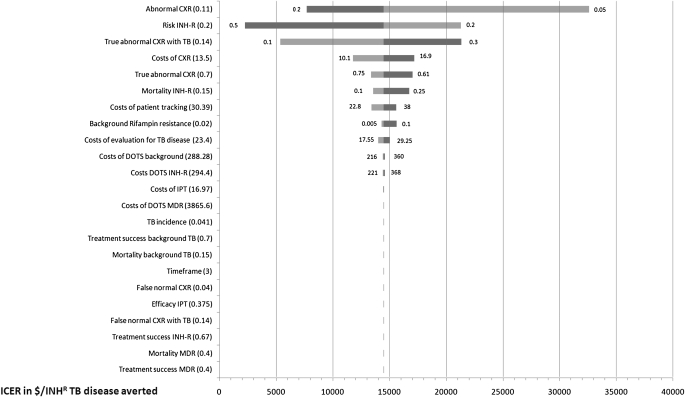
Figure 3.
Tornado diagram showing the change in the incremental cost–effectiveness ratio of the “Symptom+CXR+Tracking” policy (0% attrition) compared with the “Symptom” policy, expressed in millions of U.S. dollars per new case of isoniazid-resistant TB averted in a cohort of 10,000 HIV-infected adults. Model parameters were varied as shown in Table 1 and cost parameters were varied from 75 to 125% of the base-case values shown in Table 2. Parameters are ordered from top to bottom by their impact on model outcome. Dark bars represent the upper limits and lighter bars the lower limits of the parameter value. The base-case values are shown in parentheses on the left and $14,400 represents the base-case ICER of adding CXR and Tracking per isoniazid-resistant case of TB averted in a cohort of 10,000 HIV-infected adults screened. CXR = chest radiograph; DOTS = directly observed therapy for TB disease; INH-R = isoniazid-resistant TB disease; IPT = isoniazid preventive therapy; MDR = multidrug-resistant tuberculosis disease; TB = tuberculosis.

