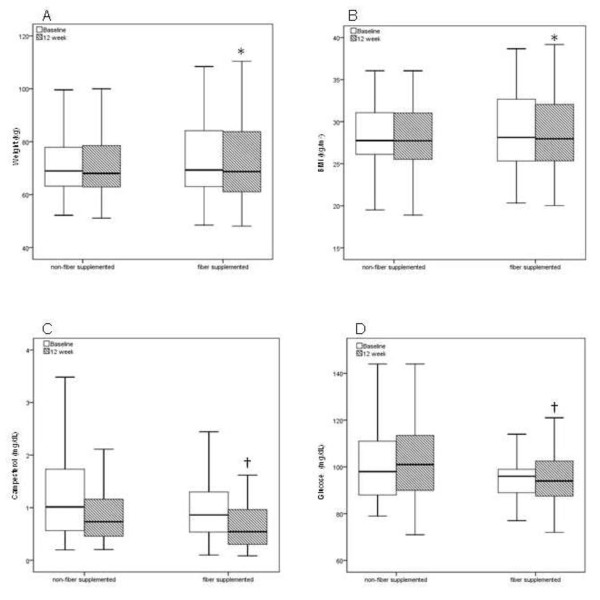
Figure 1.
Box plots of (A) Weight, (B) BMI, (C) Campesterol and (D) Glucose at baseline (white bars) and 12 weeks (dashed bars). Fiber-supplemented subjects presented mild reduction in body weight (*p = 0.04 vs. non-fiber supplemented, Student's paired t-test), body mass index (*p = 0.002 vs. non-fiber supplemented, Student's paired t-test), reduction in campesterol levels (*p = 0.033 vs. non-fiber supplemented, Student's paired t-test; †p = 0.025 vs. non-fiber supplemented, Student's independent t-test) and in blood glucose (†p = 0.035 vs. non-fiber supplemented, Student's independent t-test). BMI = body mass index.

