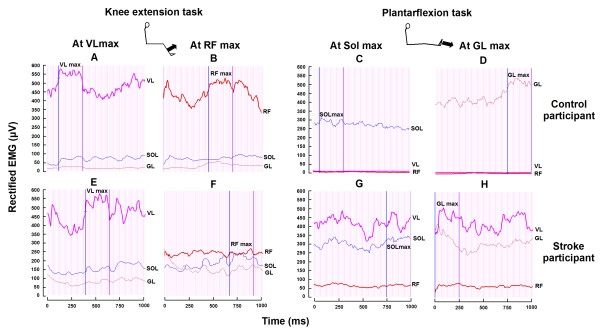
Figure 2.
Levels of EMG activity of knee and ankle extensors during the knee extension and plantarflexion tasks in a healthy and a stroke participant. Traces of rectified EMG activities of vastus lateralis (VL), rectus femoris (RF), soleus (Sol) and gastrocnemius lateralis (GL) (expressed in μV) are presented on the paretic side of a stroke participant (lower row) and on the right side of a control participant (upper row). For each participant, traces are plotted for one second of contraction during maximal knee extension (left panel) and during maximal plantarflexion (right panel). Vertical bars represent the 250-ms time windows when maximal EMG activity was achieved in VL and RF during the knee extension task and in Sol and GL during the plantarflexion task.

