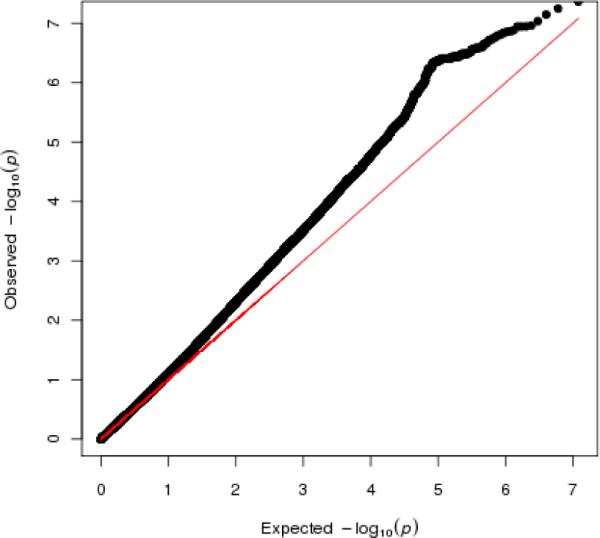
Fig. 1.

Quantile-quantile plot showing the distribution of observed –log10(p-values) against the expected –log10(p-values) for the interaction term among 12,107,627 cis-epistasis models. Deviation from the expected uniform distribution of p-values under the null hypothesis (indicated by the red line) indicates an abundance of significant cis-epistatic interactions.
