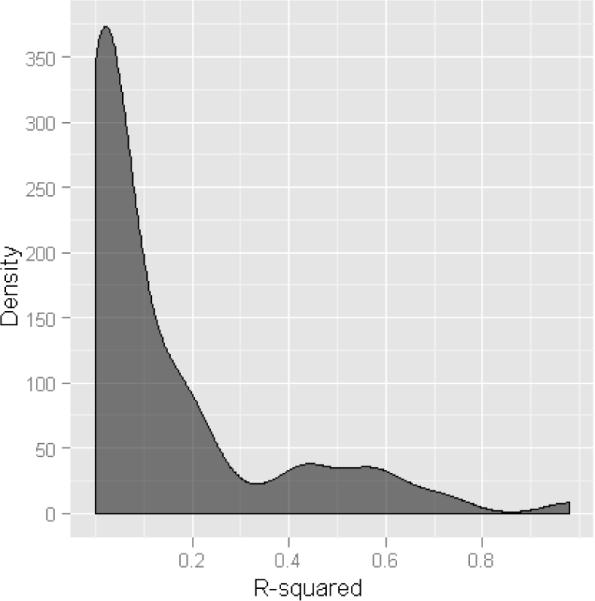
Fig. 2.

Density histogram showing distribution of linkage disequilibrium (LD) values (r2) between the most significant interacting SNP pair influencing expression of 79 genes after correcting for multiple testing. r2 was calculated using genotype data from the combined set of 210 HapMap samples.
