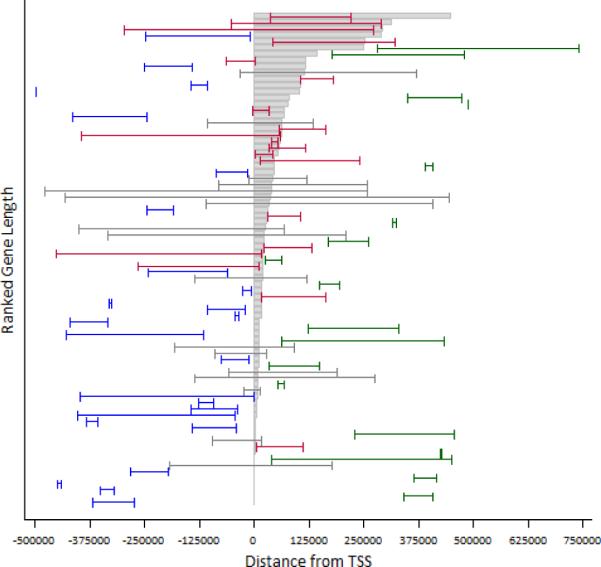
Fig. 3.

Transcribed regions of these 79 genes (gray boxes) are aligned by transcription start site, ordered by gene size. Epistatically interacting SNPs that influence the gene's expression are shown as connected hash marks, color coded by class: upstream (blue), downstream (green), spanning (gray) and intragenic (red). Analysis of the genomic structure of cis-epistatic interactions reveals that all four structural classes are evenly represented among the most significant cis-epistatic interactions, and that structural class does not correlate with gene size.
