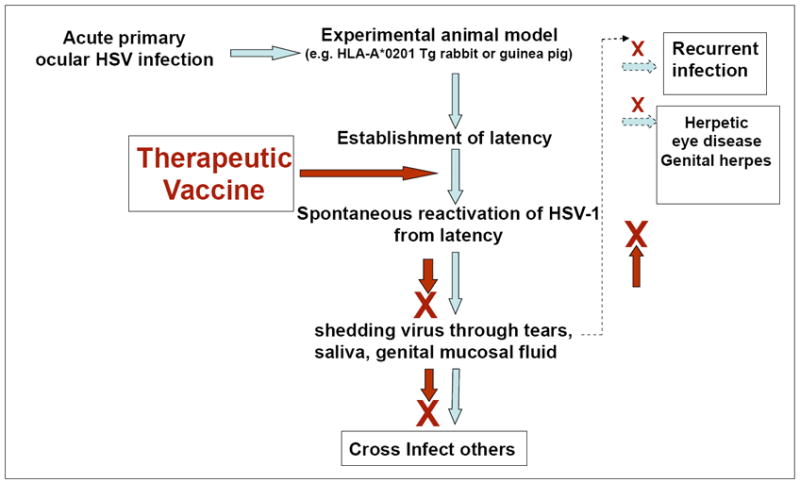
Fig. 3.

Schematic flow chart representing the HSV infection-reactivation cycle and the potential targeted step where therapeutic vaccine should intervene this cycle. The blue arrow indicates infections, latency, spontaneous reactivation, viral shedding, recurrent infection and eye disease. The brown arrow and the brown cross -indicated inhibition of spontaneous reactivation, viral shedding, recurrent infection and eye disease.
