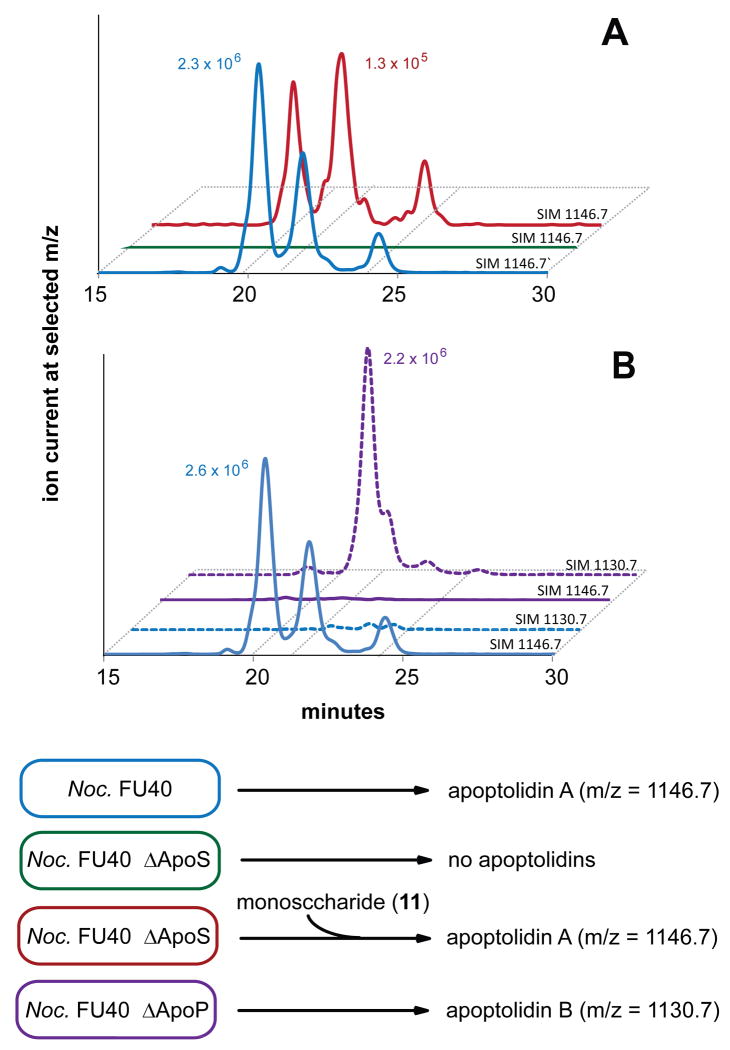
Figure 6.
Analysis of disruption mutants. Panel A, knockout of PKS: Wild-type (blue) ΔApoS8 (green) and ΔApoS8 + apoptolidin C9 monosaccharide (red) scanning for apoptolidin A ion (ES+ M+NH4/z =1146.7). Panel B, knockout of P450: Wild-type (blue) and ΔApoP (purple) monitoring for apoptolidin A (solid line, ES+ M+NH4 =1146.7) and B (dashed line, ES+ M+NH4/z =1130.7).

