Table 2.
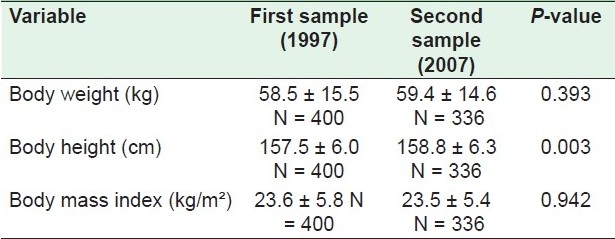
Comparison of anthropometric data between the first (1997) and the second (2007) samples. Data are mean ± standard deviation

Comparison of anthropometric data between the first (1997) and the second (2007) samples. Data are mean ± standard deviation
