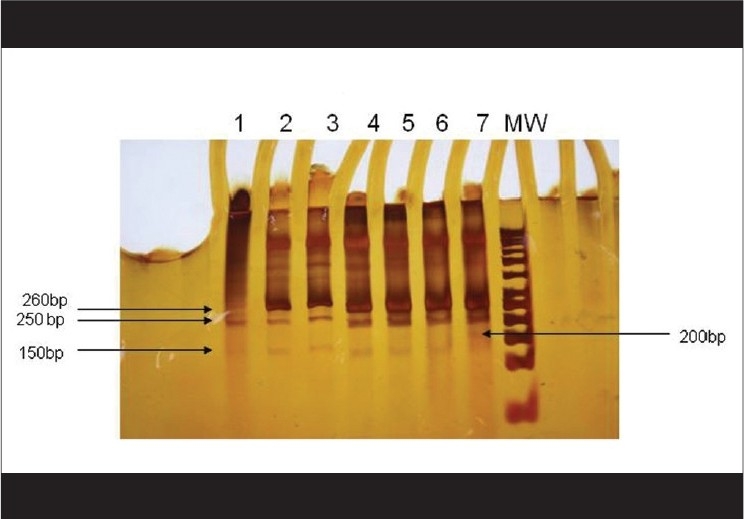
Figure 3.

SSCP pattern of the PCR products of drug-resistant and drug-sensitive fungal isolates {Starting from the left; Lanes 2,3,4,5 and 6 show three bands each that are different from the Lanes1 and 7 which lack the 150 bp band. However, the pattern on Lane 7 is totally different from the rest as it shows three clear bands of 250 bp, 200 bp, in addition to the 260 bp band which is common to all. Products on Lanes 1 and 7 belonged to strains which had shown low MIC values (≤ 1.56 μg/ml)} Lane on the extreme right (MW) shows 50 bp ladder (Molecular Weight Marker)
