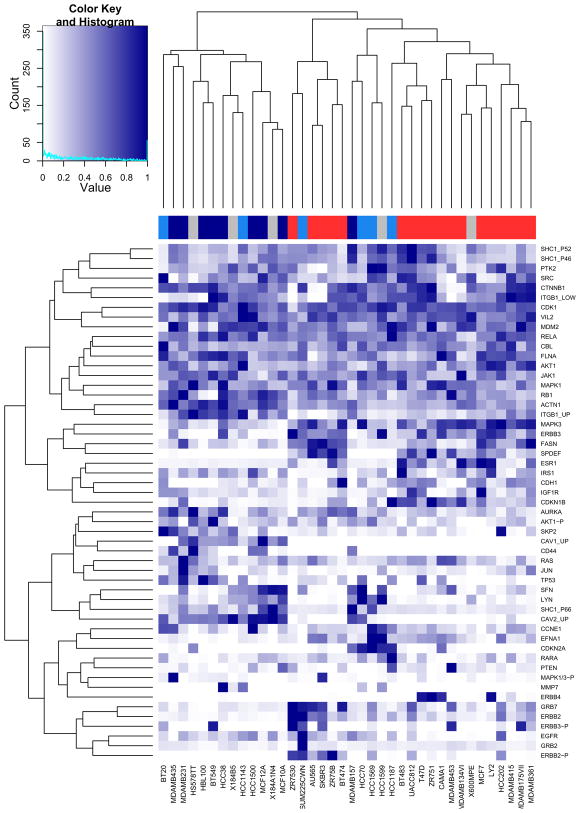
Figure 5.
Heatmap showing a hierarchical clustering of the proteins (down right hand side) and samples (along the bottom) based on the protein expression measurements. A colour sidebar for the samples indicates to which cancer type the cell line belongs: basal A (blue), basal B (darkblue), luminal (red) and unknown (grey). The inset key shows on the x-axis the color scale of the protein expression matrix, from white (normalized expression value of 0) to dark blue (normalized expression value of 1). On the y-axis is the histogram count of number of points in the heatmap that have the corresponding normalized protein expression value as indicated by the lightblue line.

