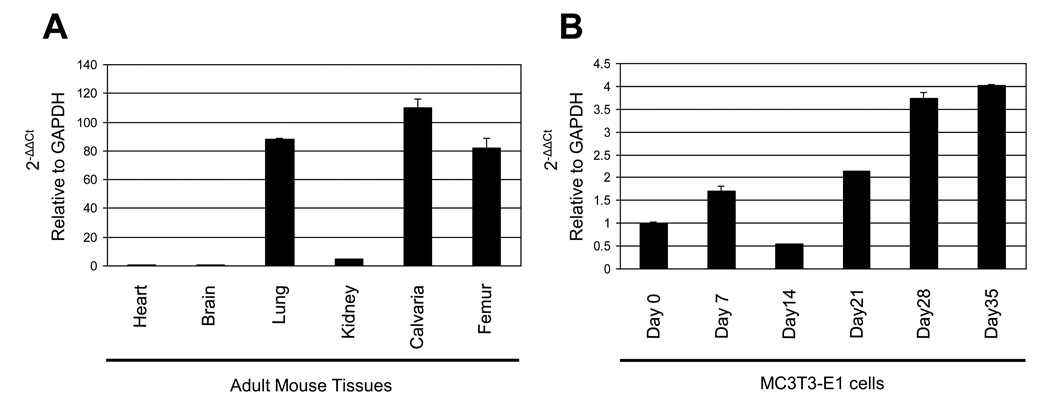
Fig. 2.
Gene expression of Podnl. Quantitative real time PCR analysis of Podnl mRNA expression was performed using adult mouse tissues (A) and cultured osteoblasts (B). The mean fold changes in the expression of Podnl relative to that of GAPDH were calculated using the value of the expression of either heart (A) or MC3T3-E1 cells at Day 0 in culture (B) as a calibrator. The values are shown as mean ± S.D. based on triplicate assays.

