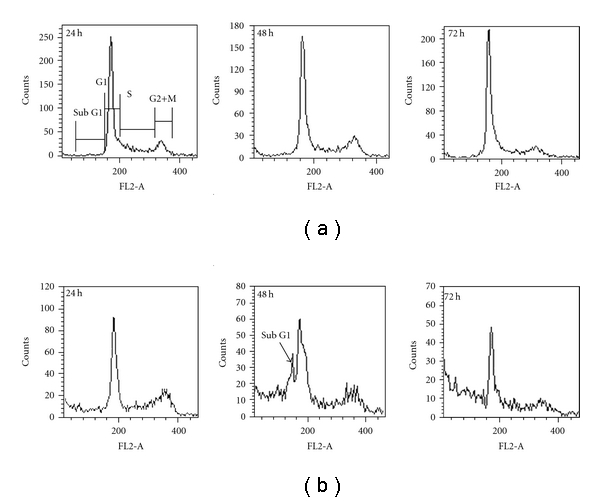
Figure 6.

Cell cycle analysis of HeLa cells after treatment with vehicle control (0.3% DMSO) or 200 μg mL−1 BDF 5. Cells were collected and processed for cytometric analysis of cell cycle distribution. DNA content was analyzed using PI staining and DNA flow cytometry. (a) Cells were treated with vehicle (0.3% DMSO). (b) Cells were treated with BDF 5 (200 μg mL−1) for different time points.
