
Figure 7.
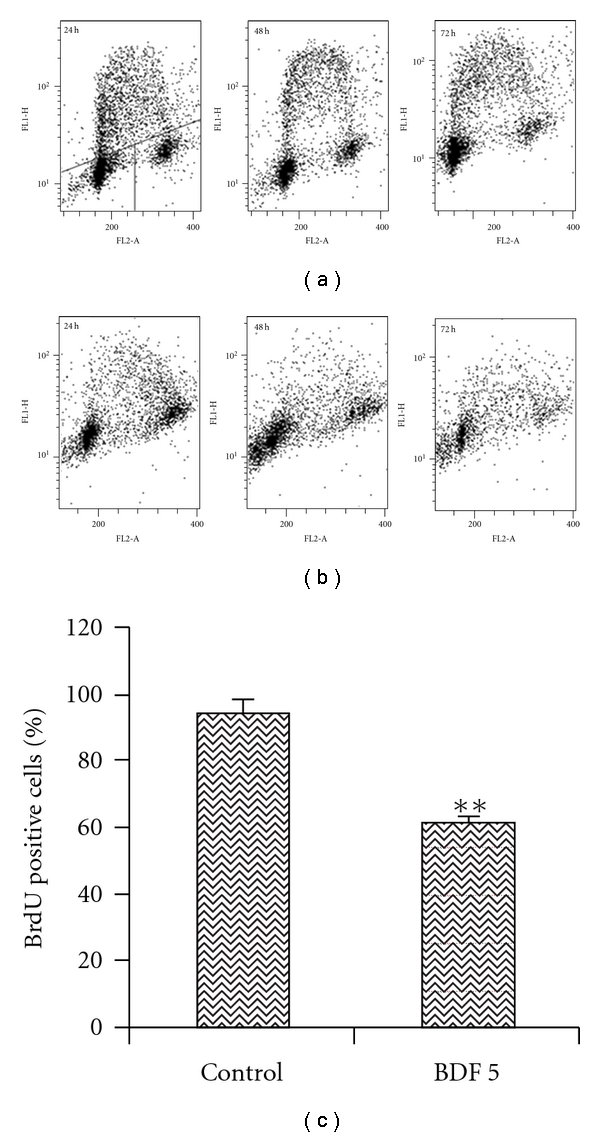
DNA synthesis in untreated HeLa cells and cells treated with BDF 5. Cells were treated with BDF 5 (200 μg mL−1) for different time point and pulsed with BrdU. Incorporation of BrdU was detected by immunofluorescence using a BrdU monoclonal antibody. The DNA content, measured by propidium iodide staining of cells, is represented as a linear scale on the abscissa, showing cells with 2 N or 4 N, respectively, in G1 (lower left of each panel) and G2/M (lower right of each panel). The ordinate is a logarithmic scale representing cells in S-phase, based on incorporation of 5-bromodeoxyuridine. (a) Cells were treated with vehicle (0.3% DMSO). (b) Cells were treated with BDF 5 (200 μg mL−1) for different time points. (c) Graphical representation of BrdU positive cells in control and BDF 5-treated cells. The data are expressed as mean ± SD from three independent experiments. **P < .01.