
Figure 2.
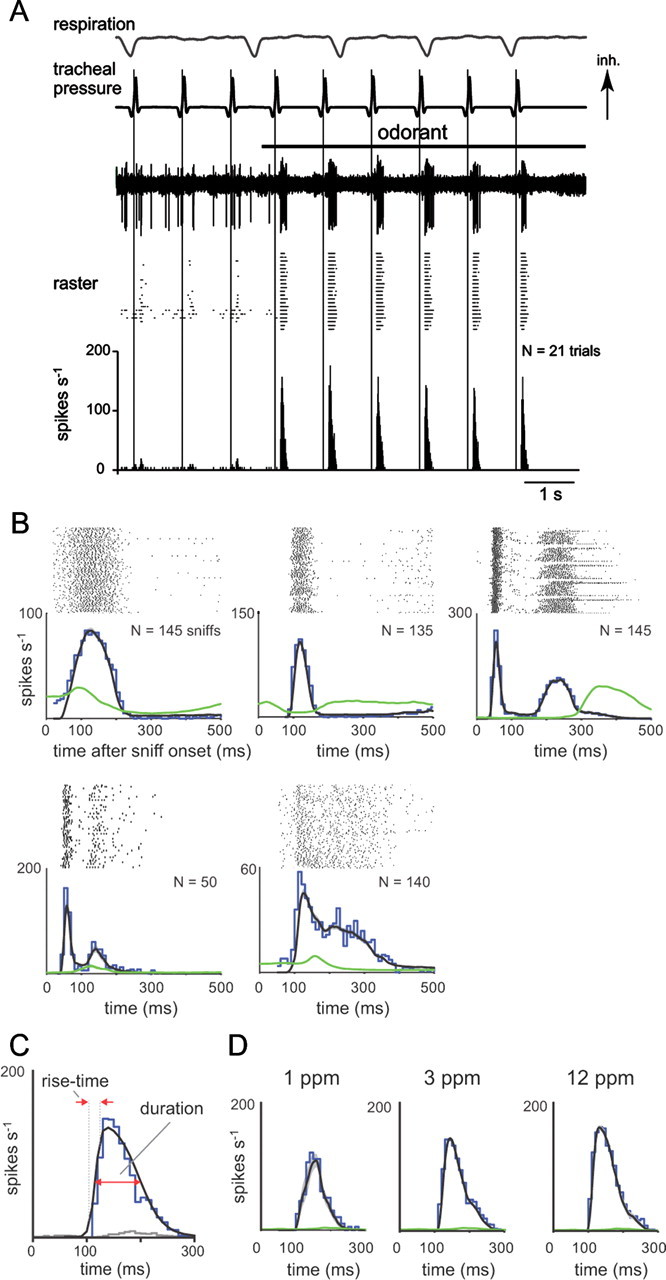
Sniff playback drives presumptive MT cell responses with diverse but reliable temporal dynamics. A, Example recording from a presumptive MT cell during odorant presentation and sniff playback at 1 Hz frequency. The top three traces show, from top to bottom, intrinsic respiration measured with a photodiode, the sniff playback signal [inhalation (Inh) is up], and voltage signals from a representative playback trial in which odorant (horizontal black bar) is presented midway through the trial. Spike times from repeated trials are shown in the raster below, and the average response histogram (10 ms bins) for all trials is shown at the bottom. This unit shows weak responses to inhalation in the absence of odorant and strong excitatory transients in the presence of odorant. B, PSTHs, constructed as described in Materials and Methods, from five different MT cells illustrating diverse temporal responses to odorant. For each cell, the sniff-triggered spike raster is shown along with the PSTH evoked during odorant presentation (blue plot). The mean instantaneous firing rate (black trace; see Materials and Methods) tracks the PSTH well and is reliable from trial to trial; the variance of instantaneous firing rate (measured as SEM and shown in gray overlaid on the black trace) is generally not apparent in these plots. The instantaneous firing rate measured in the absence of odorant is shown in green. Each cell shows a transient excitation, with a distinct but reliable temporal pattern. C, Illustration of quantification of response dynamics using the PSTH for the MT cell shown in A. Spike raster, as well as odorant-driven PSTH (blue) and nonodorant PSTH (gray) are shown. The PSTH was fitted with a double-sigmoid curve (black); this curve was used to measure peak firing rate, rise time, and duration as indicated and described in Materials and Methods. D, Example of the effect of increasing odorant concentration on MT cell response dynamics. Spike rasters and PSTHs for a cell presented with odorant (heptaldehyde) at 1 ppm (N = 20 sniffs), 3 ppm (N = 126 sniffs), and 12 ppm (N = 48 sniffs). Panel elements and colors are as in B. In this cell, increasing odorant concentration increased peak firing rate and slightly shortened rise time and latency.