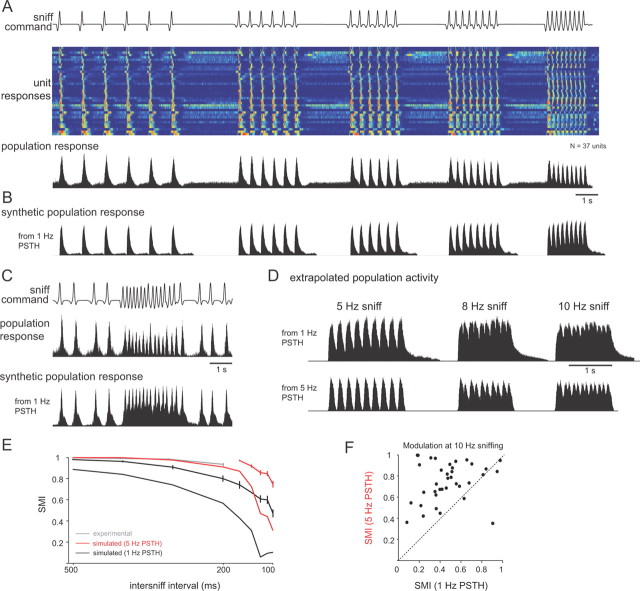
Figure 8.
Frequency-dependent transformations in response dynamics enable robust temporal patterning across the MT cell population. A, Activity evoked by the same sniff playback trace across all recorded units (N = 37 cells), compiled independently of odorant identity or concentration. Top, Playback command trace. Middle, Pseudocolor representation of firing rates (5 ms bin) for each unit, normalized to peak firing rate for each unit, one unit per row. Units are ordered by single-sniff response duration, from shortest (top) to longest. Warm colors indicate peak firing rates. Bottom, Population activity histograms generated by averaging the response histograms from all units. Each histogram was normalized to its peak firing rate before averaging. B, “Synthetic” response histogram constructed by convolving the 1 Hz PSTHs with the sniff times for each unit and then averaging these activity patterns across all units. This approach predicts population-level response patterns based solely on the responses at 1 Hz sniffing. Comparing the synthetic patterns with the actual recorded responses (as in A) indicates the degree to which frequency-dependent changes in responses shape population-level activity. Responses constructed from 1 Hz PSTHs show less modulation with sniffing compared to actual responses (compare to A). C, Population activity histograms during playback of the natural sniffing sequence. Top, Playback command trace. Middle, Population activity histogram constructed as for A. Bottom, Synthetic response histogram constructed from 1 Hz PSTHs as for B. Again, activity across the MT population maintains strong patterning and modulation with sniffing, whereas the synthetic population pattern shows less modulation. D, Extrapolation of population responses to sniff frequencies up to 8 Hz using the PSTH convolution method. Synthetic population response histograms were constructed as in A using either 1 Hz (top) or 5 Hz (bottom) PSTHs from the same units by convolving with sniff times repeated at 8 and 10 Hz. Population responses show weak modulation with sniffing using the 1 Hz PSTHs (SMI at 8 Hz, 0.16) but stronger modulation using the 5 Hz PSTHs (SMI, 0.64). E, SMI values for all units as a function of frequency measured experimentally (gray), simulated using 1 Hz PSTHs (black) and 5 Hz PSTHs (red). SMI values were measured for frequencies extrapolated up to 10 Hz by convolution (see Materials and Methods). Traces with error bars show SMI values measured across individual units; those without error bars show the SMI value for the population-averaged response. SMI values were higher for the experimental data and for responses synthesized from 5 Hz PSTHs. F, SMI values for 10 Hz sniffing extrapolated for each unit using either 1 or 5 Hz PSTHs. For nearly all units, the SMI value was higher using the 5 Hz PSTH.

