
Fig. 2.
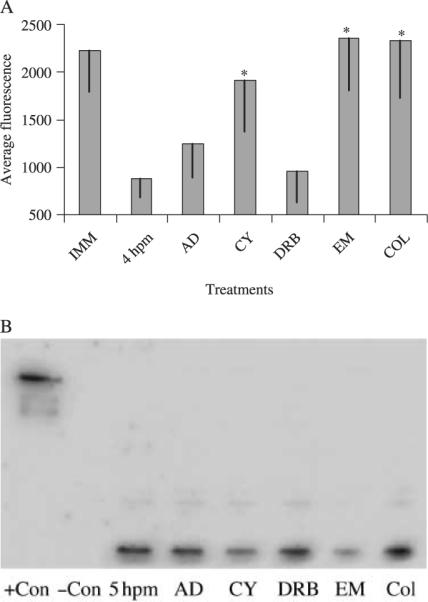
Effects of cell function inhibitors on the decrease in dye accumulation after oocyte maturation and protein analysis using the monoclonal P-gp antibody, C219, from samples of oocytes, eggs and eggs incubated with cell function inhibitors. (A) Oocytes were incubated for 2 h with cell function inhibitors 20 min after 1-methyladenine (1-MA) addition. C-am (0.25 μm) was added to the tubes and incubated for 2 h at 15°C. Transcriptional inhibitors, actinomycin D (AD) and DRB, were used at 1 μm and 100 μm, respectively. Translational inhibitors, cycloheximide (CY) and emetine (EM), were used at 2.5 μm and 100 μm, respectively. The microtubule inhibitor, colchicine (COL), was used at 100 μm. Mean (± SD) pixel fluorescence intensity of 20–30 individual oocytes and eggs was measured and averaged for each maturational time point. *Denotes significant differences using the paired t-test between the inhibitor and the untreated mature eggs (P < 0.05). Data is from oocytes extracted from A. miniata. (B) Sea star oocyte and egg protein samples analyzed by sodium dodecyl sulfate-polyacrylamide gel electrophoresis (SDS-PAGE) gel and immunoblot using the monoclonal P-gp antibody, C219. Samples of controls, 5 hpm mature eggs and mature eggs incubated with cell function inhibitors during maturation. Data is from oocytes extracted from P. ochraceous.