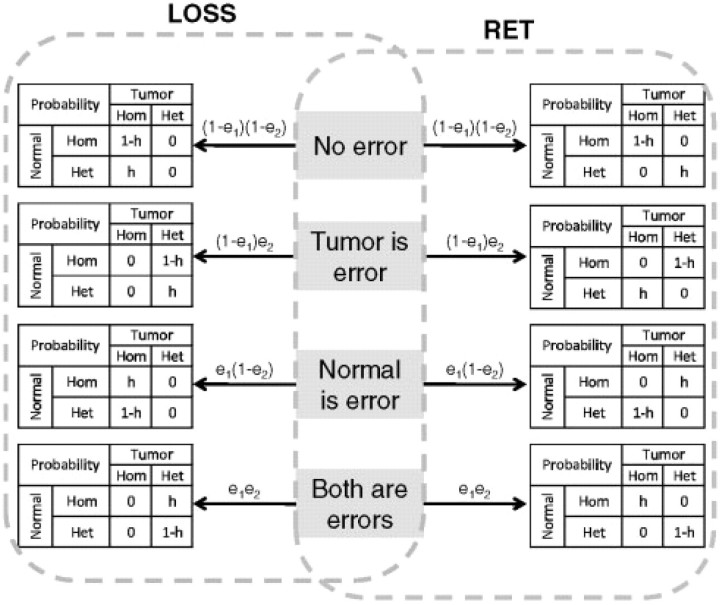
Fig. 2.
Emission probability model. The tables show the conditional probabilities of each combination of genotypes on the different error modes whose probabilities are shown above the arrows. Here, e1 is the genotyping error rate in normal samples, e2 is the genotyping error rate in tumor samples and h is the heterozygous rate of the normal samples.

