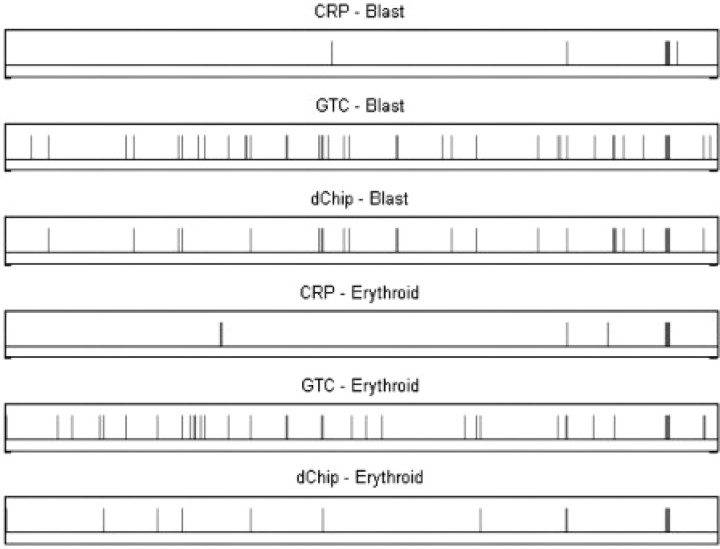
Fig. 7.
The results of CRP and HMM methods, on blast and erythroid samples of patient MDS-6. The horizontal axis is the ordered SNPs in whole genome, and the vertical bar indicates the LOH. From top to bottom: CRP result of blast, HMM (GTC) result of blast, HMM (dChip) result of blast, CRP result of erythroid, HMM (GTC) result of erythroid and HMM (dChip) result of erythroid.

