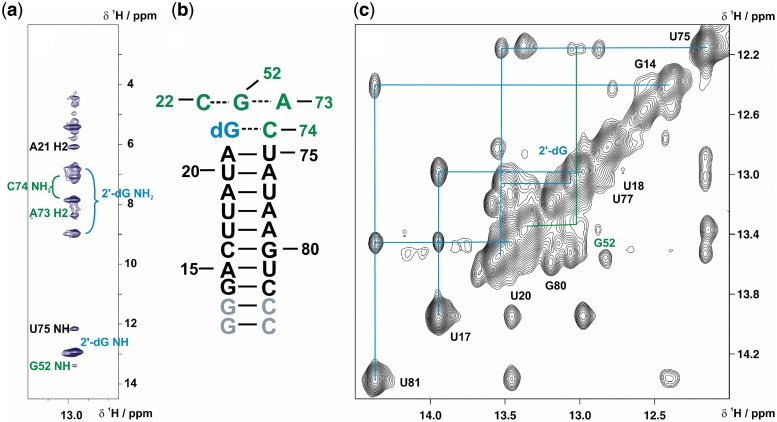
Figure 3.
RNA-ligand complex architecture determined by NMR. (a) Strip plot of a 15N-edited-NOESY spectrum of the selectively 13C,15N-cytidine-labelled aptamer in complex with 13C,15N-labelled 2′-dG showing the signals from protons within NOE distances to the 2′-dG imino proton. Resonance assignments are colour-coded according to Figure 2. (b) Secondary structure of P1 stem extended by the 2 W-C base pairs formed by 2′-dG-C74 and C22-G52. The latter base pair is predicted to form a base triple with A73, as the ligand-imino proton NOE to the A73 H2 indicates stacking of these residues. (c) Imino proton region of NOESY-spectrum (800 MHz, mixing time = 250 ms). Signal connectivities due to NOE cross peaks of the P1 imino protons is sketched. The imino proton assignments are colour-coded corresponding to the secondary structure of the aptamer (Figures 2 and 3 b).

