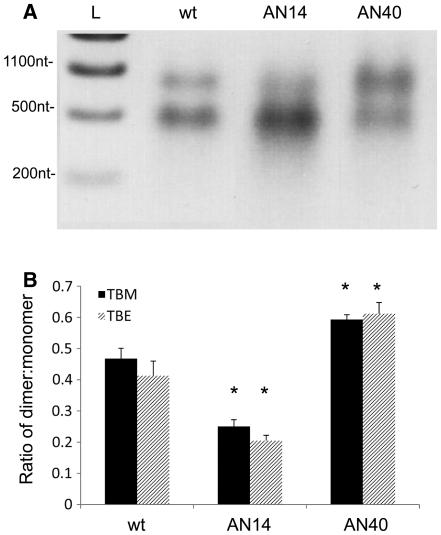
Figure 6.
Dimerization of AN40 and AN14 mutants. Wt, AN40 or AN14 RNA underwent dimerization as described in Figure 5, and the percentage of dimers and monomers was visualized by electrophoresis on 1% agarose gels in TBM or TBE. (A) Representative TBM gel. L; RNA ladder. (B) Densitometric analysis of the ratio of dimer to monomer in wt, AN40 or AN14 RNAs in TBM (black bars) or TBE gels (striped bars). Asterisks represent statistical significance relative to wt by t-test (P < 0.01). Error bars represent the SEM.

