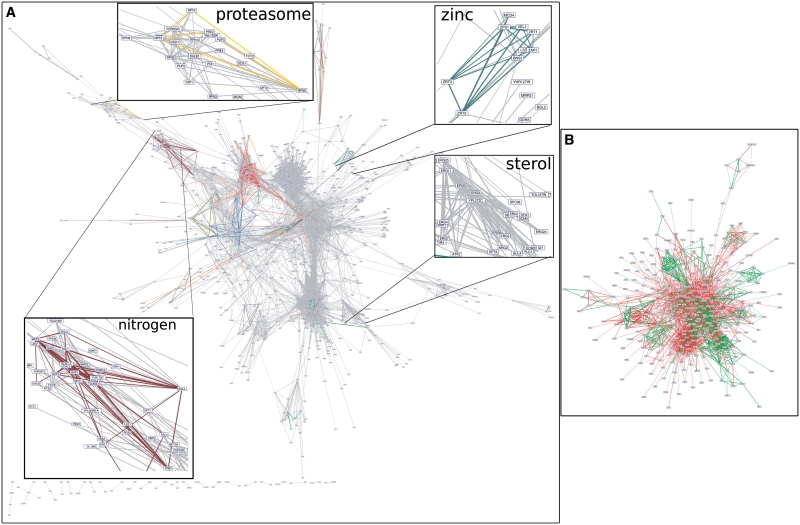
Figure 3.
Co-regulation network inferred by phylogenetic footprint discovery. (A) High-scoring layer (DPbits ≥ 5) of the co-regulation network inferred between all yeast genes. Edge thickness reflects the prediction score. Insets highlight areas of the network corresponding to groups of functionally related genes. Each color corresponds to one annotated regulon. (B) Subset of the inferred network restricted to the 612 genes of the reference data set (80 regulons, DPbits ≥ 1). Green edges: co-regulations already supported by annotations; non-supported predictions, combining novel predictions and false positives.

