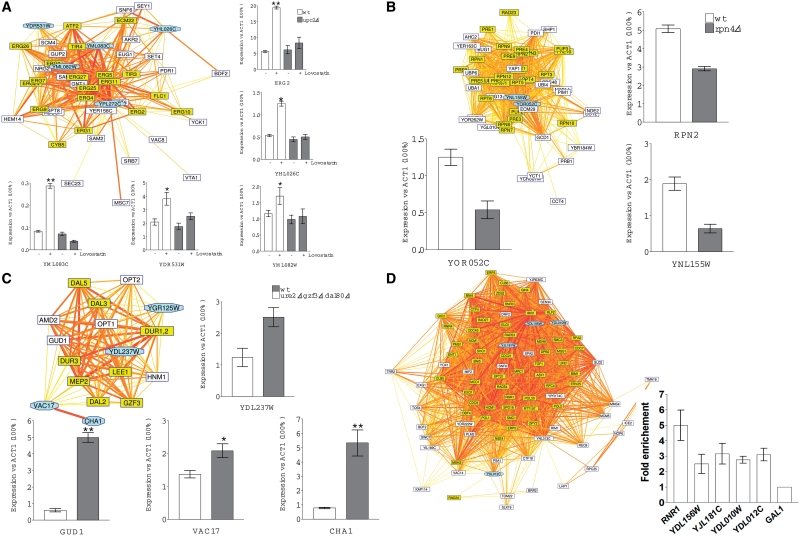
Figure 6.
Experimental validation of selected inferred regulations by qRT–PCR and ChIP analyses. Each panel shows a cluster of neighbor genes in the inferred network, together with the experimental measurement of the transcriptional responses. (A) Effect of Lovastatin and UPC2 deletion on RNA levels of four potentially Upc2 regulated genes, using ERG2 as control. Lovastatin (40 µg/ml) was added to the cultures for 16 h before cell harvesting. RNA levels were quantified by qRT–PCR and data were expressed versus the actin gene (ACT1) used a non-regulated reference. (B) Effect of the RPN4 deletion on two potentially Rpn4 regulated genes using RPN2 as a positive control. Cells were grown on the YPD medium; experiments were performed as in (A). (C) Derepressing effect of the triple ure2 gzf3 dal80 mutations on the RNA levels of four genes potentially subject to nitrogen catabolite repression. Cells were grown on glutamine as the sole nitrogen source. Experiments were performed as in (A). (D) ChIP PCR analysis of four potentially Mbp1 regulated genes. Mbp1-HA expressing cells were grown on YPD and the promoter occupancy by Mbp1 was monitored by ChIP for RNR1 (a known target gene of Mbp1) and the four indicated genes. Data were expressed versus the GAL1 gene used as a reference. Color code for the network clusters: genes known to be submitted to a common regulation are highlighted in yellow. Cyan-shaded octagonal boxes indicate genes submitted for experimental validation.

