
Table 1.
Size of the inferred and annotated data sets
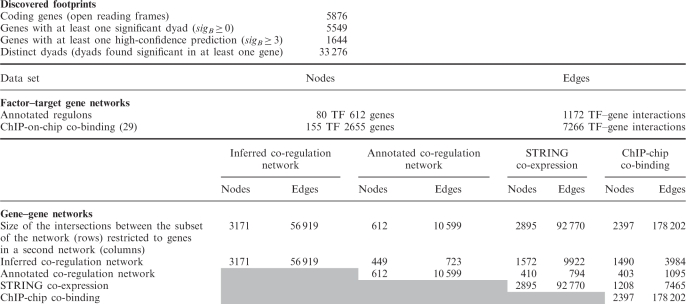 |
Discovered footprints (top), i.e. motifs over-represented in the promoters of orthologous genes. Reference data sets indicating interactions between TFs and their target genes (middle). Annotated regulons were used to build the co-regulation network, whereas the ChIP-on-chip results were used to build the co-binding network. Comparison between inferred and reference networks (bottom). The diagonal indicates the size (nodes and edges) of each network; the other cells indicate the size of the pairwise intersections between networks.