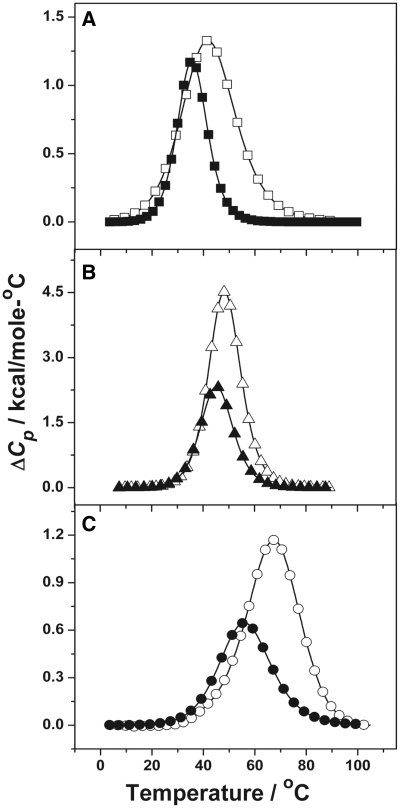
Figure 4.
Calorimetric transition curves for ODNs in 10 mM sodium phosphate buffer (pH 7): (A) ODN-1 (open square) at 200 µM and ODN-2 (filled square) at 256 µM. (B) ODN-3 (open circle) at 110 µM and ODN-4 (filled triangle) at 130 µM. (C) ODN-5 (open circle) at 200 µM and ODN-6 (filled circle) at 264 µM total strand concentration.

