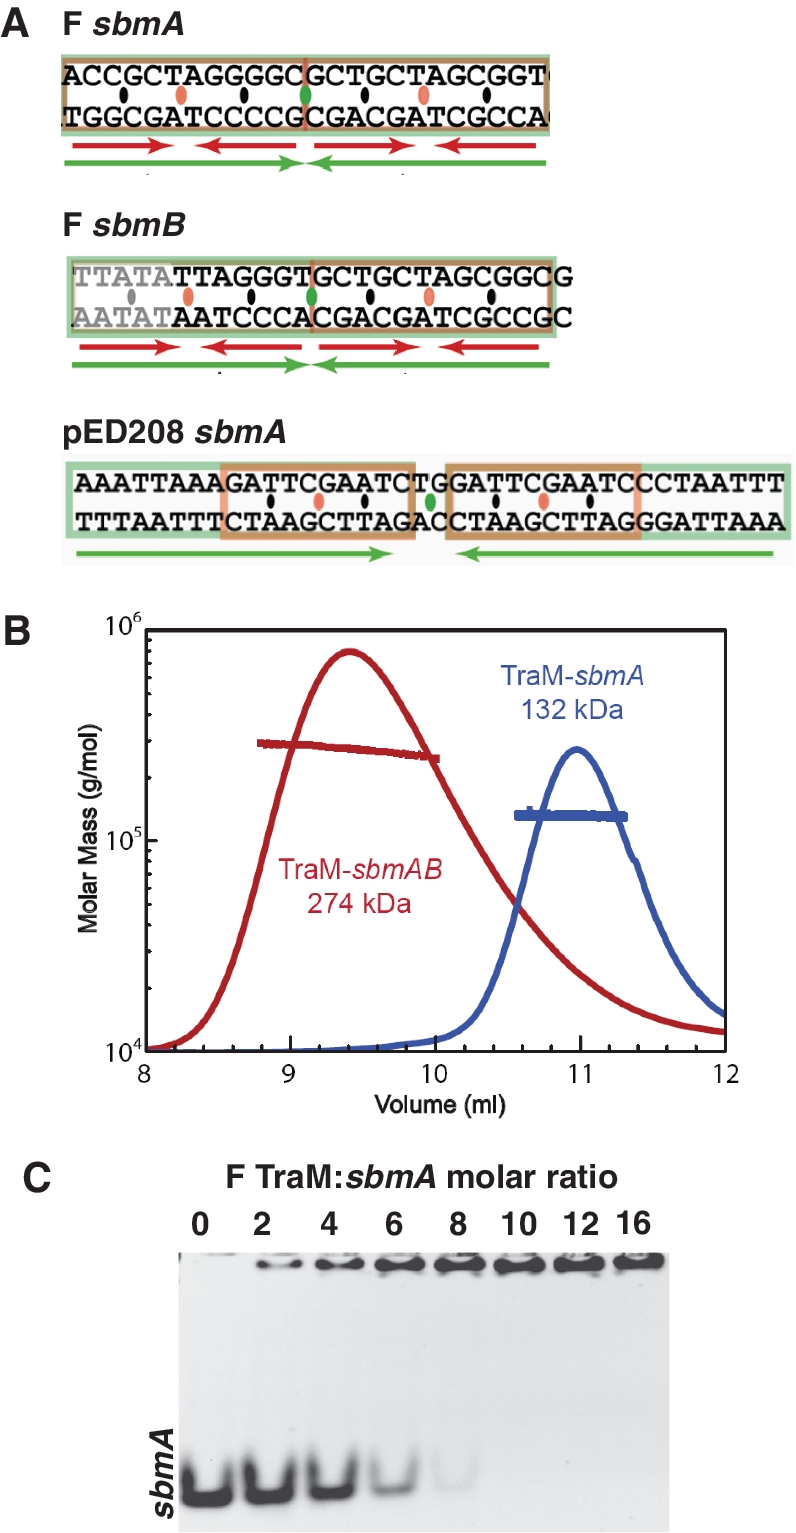
Figure 2.

Binding of F and pED208 TraM to sbm DNA. (A) The sbm sequences from F and pED208 plasmids. Inverted repeats are indicated with green and red arrows. TraM-binding motifs are separated by orange ovals, and their centers of symmetry are indicated by black ovals. The center of symmetry of the sbm site is indicated by a green oval. (B) MALLS analysis of molecular weight of F TraM 30-bp sbmA complex and TraM 75-bp sbmAB complex. The traced peaks are the refractive index of the eluted material and the superimposed lines indicate the molecular weight of the protein or protein–DNA complex over the corresponding portion of the elution peaks. (C) Binding stoichiometry analyzed by titration of F TraM with 30-bp sbmA.
