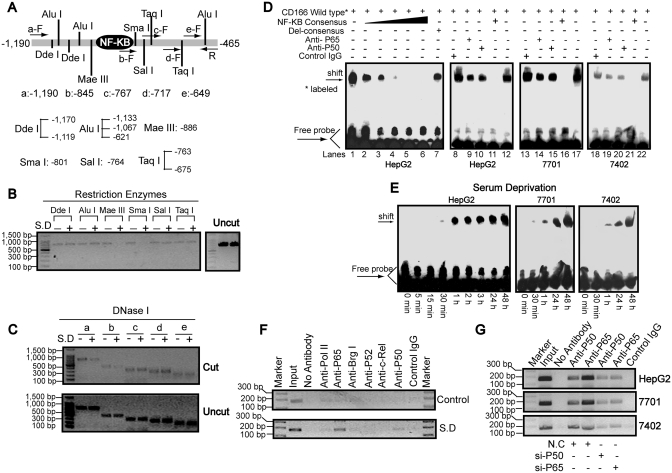
Figure 3.
Binding of NF-κB to the CD166 promoter. (A) Schematic representation of the restriction enzyme positions and primers used to map the serum starvation-response site from −1190 to −465 (relative to the TSS) region by chart-PCR assays. (B) Nuclei of HepG2 cells before or after SD for 1 day were purified and digested with 5–15 U of different restriction enzymes, as indicated, per 100 μl reaction system for 30 min. Purified DNA treated with or without enzymes (uncut) was semi-quantitated using primer sets a–F and R after 30 cycles of PCR reactions. (C) Purified DNA from HepG2 cells before or after SD for 1 day treated with (cut) or without (uncut) 3 U of DNase I for 5 min at 37°C was semi-quantitated using primer sets R and a–e, which were the same as indicated in Figure 3A after 29 PCR cycles. (D) Nuclear extracts from three different hepatoma cell lines treated with SD for 1 day were assayed by EMSA using biotin-labeled oligonucleotide probes (from −858 to −834) and NF-κB consensus probes. Shifted bands were verified by addition 5 μg either nonspecific control IgG or specific antibodies against P65 or P50, as indicated. (E) EMSA assays were performed using nuclear extracts from cells by treatment of SD for indicated time and wild-type probes (from −858 to −834). (F) ChIP analysis was performed to qualitatively confirm the interaction of NF-κB components, Pol II and Brg I with the promoter in vivo. As the negative controls, the protein–DNA complexes were incubated without antibodies or with non-specific control IgG. The input DNA represents 1/20th of the starting material. (G) In vivo interactions of NF-κB with CD166 promoter after SD upon suppression of P50/P65 protein by specific siRNA were determined by ChIP assay.

