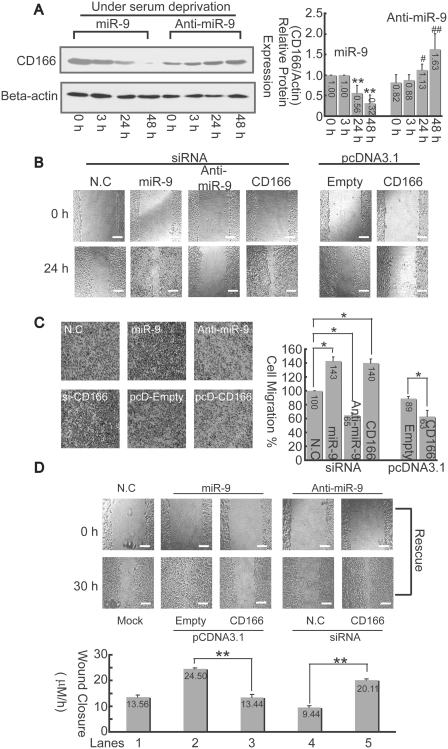
Figure 7.
miR-9 promotes cell migration via inhibition to CD166. (A) Changes of CD166 protein in HepG2 cells were detected by western-blotting assays after transfection with 70 nM either miR-9 mimics or miR-9 inhibitor under SD at different time point as indicated (left panel). The relative CD166 protein expression levels were quantitated, and the intensities of the bands of CD166 were normalized to those of β-actin (right panel). *P < 0.05, and **P < 0.01 versus the ‘miR-9 treated-0 h’; #P < 0.05 and ##P < 0.01 versus the ‘anti-miR-9 treated 0 h’. (B) Cells were wounded before transfection with either siRNA or expression vectors as indicated. Then, the culture was continued for 24 h. The bar, 200 μm. (C) Cell-migration assay was carried out with trans-well culture chambers. Transfected with either siRNA or pcDNA3.1 expression vectors as described in (B), 4 × 10⁴ HepG2 cells were seeded into the upper wells. After 24 h, the cells migrating to the lower surface of the membrane were examined (original magnification 40×). Five different areas of migrated cells were counted for each data point (n = 5), and the counts were averaged (right panel). The data is presented relative to cells transfected with negative control siRNA, which is normalized to 100%. The asterisk indicates a significant difference (*P < 0.05). (D) CD166 reverse miR-9 promoted cell-migration activity. Either miR-9 mimics or inhibitor were co-transfected with CD166 expression vector or siRNA into HepG2 cells for 30 h. Afterwards, average rates of wound closure were calculated from three independent experiments. The bar, 200 μm.

