Figure 4.
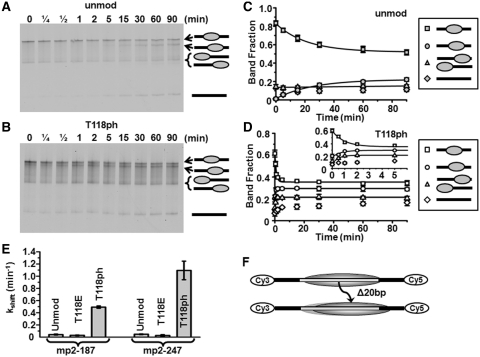
H3(T118ph) increases the rate of nucleosome mobility. (A and B) Cy5 fluorescence images of thermally (53°C) induced repositioning visualized by EMSA of unmodified and H3(T118ph) mp2-247 NPS nucleosomes, respectively. The top band is centrally positioned nucleosomes, the second band is nucleosomes shifted toward the Cy5 end from the center by 20 bp, the third band is nucleosomes positioned at the Cy3 or Cy5 end of the DNA and the bottom band is naked DNA (diagramed on right, See Supplementary Figures S3 and S4 for mapping of nucleosome positions). (C and D) Quantification of the fraction of center positioned nucleosomes (squares), 20 bp shifted nucleosomes (circles), end positioned nucleosomes (triangles) and naked DNA (diamonds). The error bars were determined from the standard deviation of each time point from at least three separate experiments. The kinetic evolution of each nucleosome position was fit to a single exponential decay. The inset shows the first 6 min of plot (D). (E) Summary of the characteristic decay times for repositioning of the central nucleosome position within the mp2-187 NPS (Supplementary Figure S3) and mp2-247 NPS. (F) Diagram of the change in nucleosome positions at 53°C.

