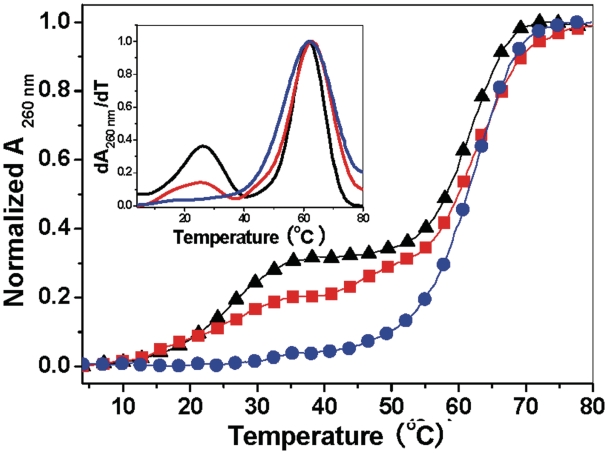
Figure 6.
UV melting profiles of 1 µM d(CT)·d(AG) in the presence of 5 μg ml−1 SWNT–COOH (black line), 5 μg ml−1 SWNT–CH2–OH (red line) and 5 μg ml−1 SWNT–CH2–NH2 (blue line) in cacodylic buffer (1 mM cacodylic acid/sodium cacodylate/200 mM NaCl/pH 6.5). (Inset) The plot of their individual derivative of dA260nm/dT versus temperature.

