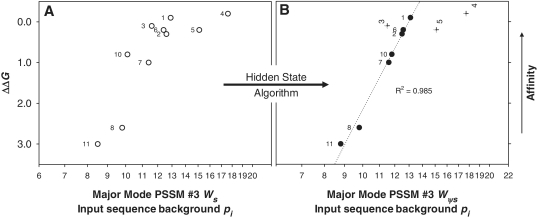
Figure 3.
Affinity (ΔΔG) versus weight score (Ws) comparison of all 10 published endogenous SyCrp1 binding sites validating the PSSM #3 model. Traditional (open symbols) and Ψ-plots (closed symbols) for both dyad and dyad (+13)bend His-SyCrp1/DNA conformers are shown. Substrate ΔΔG values relative to ΔG for ICAP were obtained from experiments performed by Omagari et al. (20). PSSM #3 was the scanning matrix for calculating all scores. The highest score fitting to PSSM #3 (either strand orientation) is shown using all 10 input sequences as the background pi. (A) PSSM #3 used to calculate Ws for all known SyCrp1 sequence-specific binding substrates (open circles). (B) PSSM #3 calculated ψ-scores (Wψs) of ψHis-SyCrp1 (closed circles and crosses) by application of a HS algorithm. Specific ψ-sequences, ΔΔG values and PSSM #3 calculated ψ-scores are clearly listed in Supplementary Table S35. Outliers (crosses) are labeled vertically and not included in the R2 value because they are distinct from the major mode trendline. The R2 value for the major mode trendline (dotted) was obtained by fitting to y = y0 + alnx. ΔΔG is the same for any given substrate in each plot. Substrates are labeled as previously (20). Here, 4 = slr1351 and 2 = sll1268 substrates from Figure 1A. Note logarithmic scaling of the abscissa.

