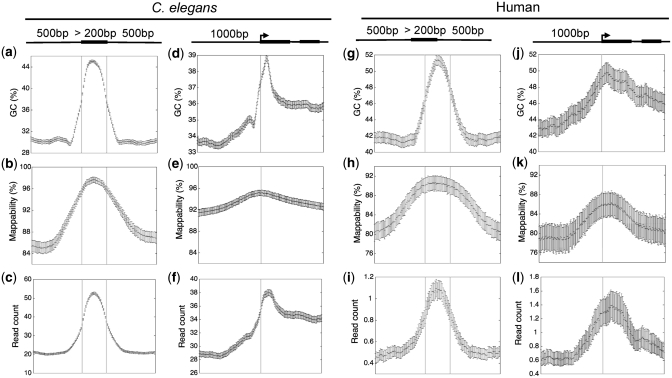
Figure 2.
Bias in GC content (a, d, g, j), mappability (b, e, h, k) and raw input sequence signals (c, f, i, l) across internal exons and around transcript start sites in C. elegans and human. The error bars represent the 95% confidence intervals of the estimated mean GC, mappability or sequence signal values.

