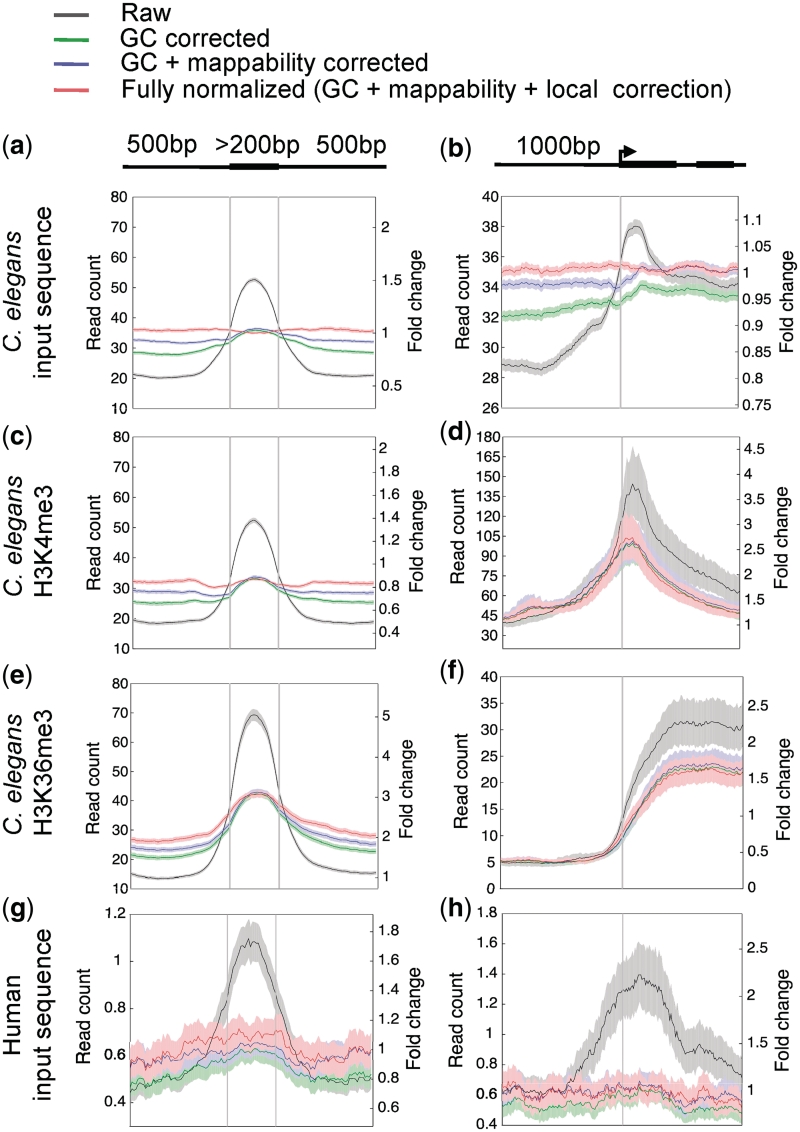
Figure 3.
BEADS normalization of high-throughput sequence reads of C. elegans input sequence (a, b), H3K4me3 ChIP (c, d), H3K36me3 ChIP (e, f) and human input sequence (g, h) libraries. Shown are the results following each step of correction: Raw (uncorrected), GC corrected, GC + mappability corrected, and GC + mappability + local corrected signals. Plots show signals across internal exons and around transcript start sites of all genes; except in d and f, only transcript start sites of highly expressed genes were used (see ‘Materials and Methods’ section). The normalized signals are plotted as relative normalized read counts (left-hand y-axis). The fully normalized signal is also plotted as fold-change relative to the genomic average (right-hand y-axis). Solid lines show average signal and shaded regions show 95% confidence intervals. Genomic read-count averages for the C. elegans input-control, H3K4me3, H3K36me3 and human input-control libraries are 33.0, 29.8, 14.6 and 0.4, respectively.

