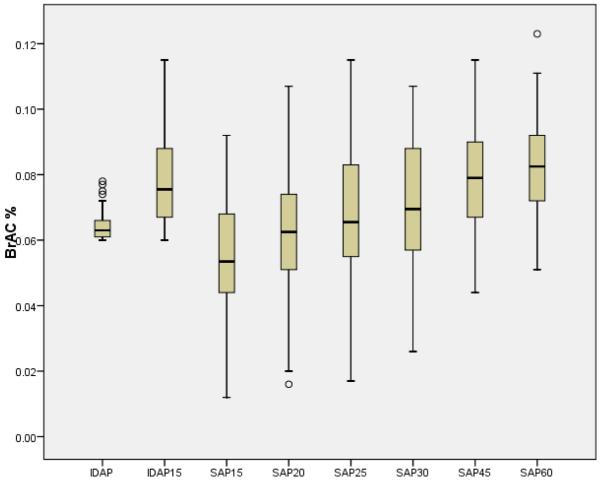
Figure 1.
Box plot showing the variability resulting from varying hypothetical idiographically determined versus standard absorption periods. IDAP = idiographically determined absorption period (criterion BrAC = .06%). IDAP15 = IDAP + 15 minutes. SAPx = standard absorption period of x minutes. Median values denoted by horizontal line in each box. Whiskers indicate minimum and maximum values. Box lengths indicate interquartile range. Circles indicate outliers (> 1.5 interquartiles away from the box).

