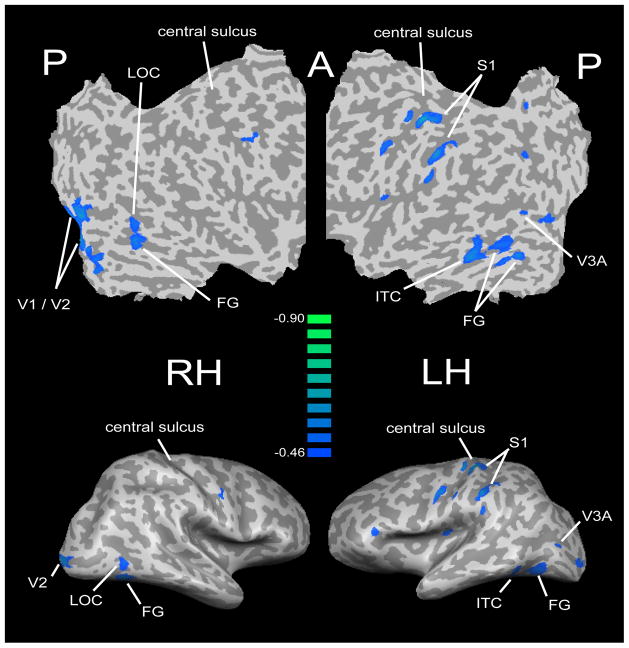
Figure 2.
Flat maps (top) and lateral views of inflated representations (bottom) of the right and left hemisphere (RH, LH) showing regions whose activation magnitude in the offset task (relative to rest) predicted tactile acuity threshold in a group of blind subjects including early and late blind. Scale represents correlation coefficient (r) of this predictive relationship. Modified from Stilla et al. (2008b). Abbreviations in Figures 1&2 refer to areas discussed in the text.

