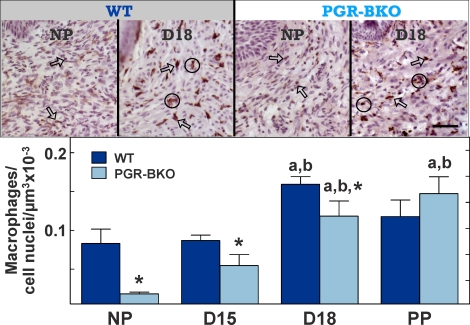
FIG. 2.
Top) Photomicrographs of macrophages in the cervix of NP or Day 18 (D18) WT and PGR-BKO mice. Dark BM8-labeled cells contrast with pale counterstained cell nuclei (brown vs. violet, respectively). Arrows point to examples of individual cells, whereas clusters of macrophages are within circles. Scale bar = 50 μm. Bottom) Number of macrophages (mean ± SEM, n = 3–6 per group per strain) in the cervix from WT and PGR-BKO mice. Data are normalized to cell nuclei to adjust for tissue hypertrophy. D15, Day 15; PP, postpartum. aP < 0.05 vs. NP, same strain, by ANOVA, bP < 0.05 vs. D15, same strain, by ANOVA, *P < 0.05 vs. WT, same day, by Student t-test.

