Figure 2.
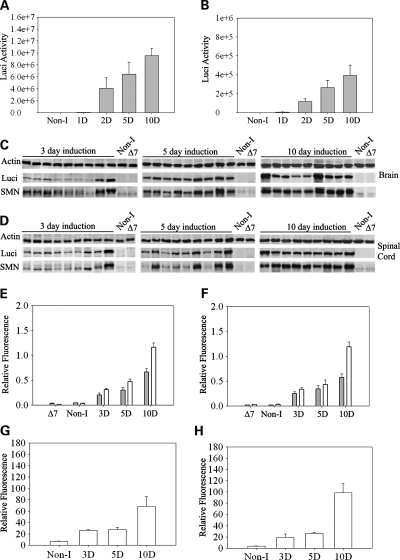
Analysis of SMN induction in neonatal mice. (A and B) Doxycycline was administered to the mother at PND0 (birth of the pups) and luciferase activity measured in the (A) brain and (B) spinal cord of the neonates at the indicated time after the start of induction. D indicates the number of days after the start of induction. (C and D) Western blots of (C) brain and (D) spinal cord tissue of the neonates for quantification of luciferase (Luci), SMN and actin. Non-I indicates mice of the same genotype as induced mice but without induction, ▵7 indicates ▵7 carrier mice (SMN2+/+;Smn+/−; SMN▵7+/+) without the inducible transgene. All induced mice are heterozygous for mouse Smn (Smn+/−) and SMN is detected with a human specific antibody. (E and F) Quantification of luciferase to actin ratio (grey bars) and SMN to actin ratio (white bars) from western blots of neonatal mice post-induction shown in (C) and (D). (n= 24 mice at day 3, n= 17 mice at day 17, n= 19 mice at day 10). (G and H) Real-time RT–PCR of full-length human SMN mRNA relative to cyclophilin mRNA after induction of SMN in (G) brain and (H) spinal cord tissue. (n= 4 mice for Non-I, n= 4 mice at day 3, n= 5 mice at day 5, n= 7 mice at day 10).

