Figure 4.
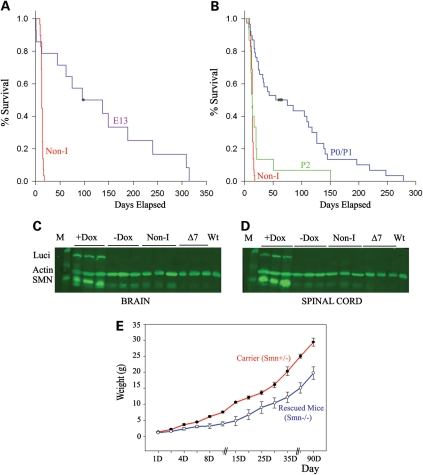
Survival analysis of induced mice. (A) Survival curve of SMA mice induced for SMN at embryonic day 13 compared with non-induced mice of the same genotype. Non-induced SMA mice lived an average of 13 days and none lived past 18 days (n= 29 mice). Induced mice lived on average for 132 ± 32 days and some lived passed 200 days (n= 14 mice), Log Rank P ≤ 0.001 compared with non-induced mice. (B) Survival curve of SMA mice induced for SMN at PND0/PND01 compared with non-induced mice of the same genotype. The average survival of mice with PND0/PND01 induction was 86 days with a number of mice living past 200 days (n= 38 mice), Log Rank P ≤ 0.001 compared with non-induced mice. The non-induced SMA mice lived an average of 13 days and none lived past 18 days (n= 29). When induction was started at PND02 some mice did show extended survival (mean 25 ± 9, max 151 days) but a lower and less pronounced response was observed (n= 15 mice). (C and D) Western blot analysis showing SMA mice with SMN and luciferase induction (+Dox) and SMA mice that had SMN induced for 28 days and then doxycycline was removed for 10 days (−Dox) in (C) brain and (D) spinal cord tissue. Human specific SMN antibody was used (48). Non-I indicates animals of the same genotype apart from the mouse Smn locus (Smn+/−) that were not fed doxycycline. ▵7 indicates ▵7 SMA carrier mice. WT indicates wild-type mice. (E) Weight curve of carrier Smn+/− mice (n= 20 mice) and rescued Smn−/− SMA mice (n= 10 mice) with SMN induction. Notice the reduced weight of rescued mice although they do steadily increase in weight.

