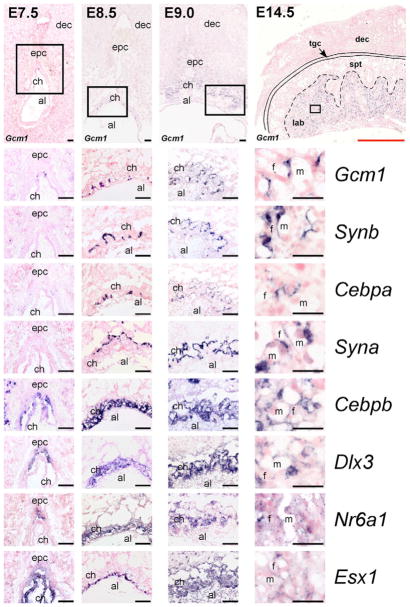
Fig. 1. Expression of mouse labyrinth trophoblast markers from E7.5-14.5.
In situ hybridizations for the labyrinth trophoblast markers Gcm1, Synb, Cebpa, Syna, Cebpb, Dlx3, Nr6a1 and Esx1 at E7.5, E8.5, E9.0 and E14.5. Low-magnification images (top row) are of Gcm1 expression. Black boxes indicate the areas shown at high-magnification in the panels beneath. al, allantois; ch, chorion; dec, decidua; epc, ectoplacental cone; f, fetal blood space; lab, labyrinth; m, maternal blood space; spt, spongiotrophoblast; tgc, trophoblast giant cell. Scale bars: black, 100 μm; red, 1.4 mm.

